Azure OpenAI Global Standard Deployment Latency Risks: A Production Environment Survival Guide

How Azure OpenAI Global Standard's shared capacity can silently degrade production performance even when all health metrics look green.
Azure OpenAI Global Standard deployments can suffer severe latency spikes—from 2–3 seconds to over 50 seconds—under shared-capacity pressure, with no error codes or health alerts triggered. This guide explains why quota headroom doesn't guarantee throughput, how internal queuing masks real degradation, and how to mitigate risks using PTU deployments, hybrid routing, and percentile-based latency monitoring.
A Typical Production Latency Incident
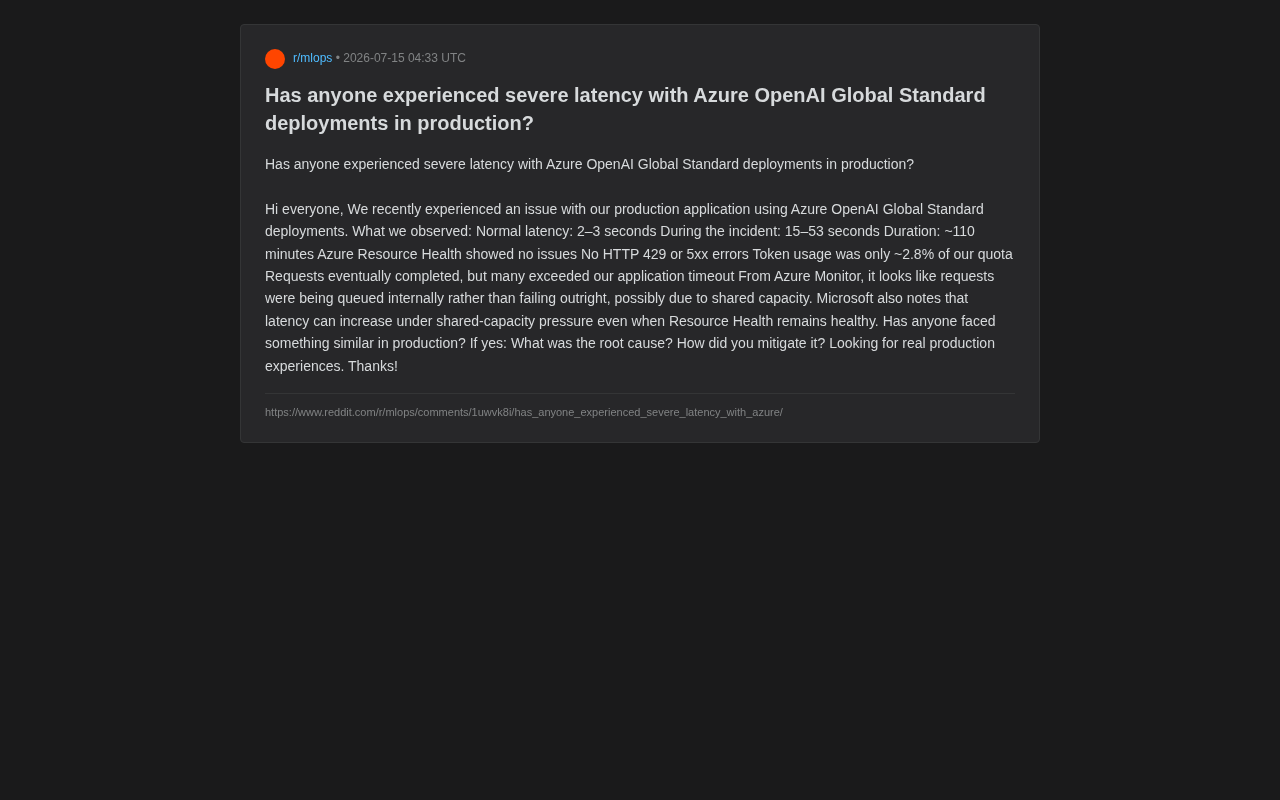
Recently, a developer shared a serious latency issue on Reddit involving Azure OpenAI Global Standard deployment in a production environment. The case is highly instructive — it exposes a hidden risk in shared-capacity cloud AI services: a service that appears "healthy" on the surface can experience order-of-magnitude response time degradation beneath it.
According to the developer's account, the key incident metrics were:
- Normal latency: 2–3 seconds
- Latency during the incident: 15–53 seconds
- Duration: approximately 110 minutes
- Azure Resource Health: showed no anomalies
- Error codes: no HTTP 429 (rate limiting) or 5xx (server errors)
- Token usage: approximately 2.8% of quota
The most critical detail: requests eventually completed, but because responses were so slow, a large number of requests exceeded the application-layer timeout threshold and appeared as failures to end users. This "slow equals broken" scenario is often far harder to diagnose and trace than outright errors.
Why Did Monitoring Show Everything as Normal?
The most confusing aspect of this incident was that every conventional health metric showed green: no rate-limiting errors, no server-side errors, quota far from exhausted, and the Azure Resource Health dashboard completely clear — yet the actual user experience had severely degraded.
From Azure Monitor observations, requests appeared to be queued internally rather than failing outright. This aligns with Microsoft's official documentation: under shared-capacity pressure, latency can climb significantly even while Resource Health remains healthy.
The Nature of Shared Capacity
The defining characteristic of Global Standard deployment is that it is "shared." Rather than reserving dedicated compute for individual customers, it routes requests to a resource pool shared across many global tenants. The advantages of this model are clear:
- Lower cost with pay-as-you-go pricing
- No upfront capacity planning required
- Ability to leverage idle compute across the globe
But the trade-off is equally clear: when the shared resource pool is under heavy load, individual requests will experience queuing — and that queuing does not trigger traditional error codes. Quota may be nowhere near exhausted, yet physical compute resources are already strained. These are two entirely different constraint dimensions.
Root Cause Analysis: The Line Between Slow and Broken
Understanding the architectural root causes of these issues helps teams develop more targeted mitigation strategies.
1. Quota ≠ Guaranteed Throughput
Many teams mistakenly assume that staying within their token quota guarantees performance. In reality, Azure OpenAI quotas (TPM/RPM) control how many requests you can submit, not how quickly those requests will return. In shared mode, actual processing speed depends on the instantaneous load across the entire resource pool — a variable that quota mechanisms simply cannot cover.
2. Queuing Masks Real Pressure
When the backend chooses to queue requests rather than reject them, the client-side sees no "failure signal." This design intent is to improve overall success rates, but for production applications with strict latency requirements (SLAs), it becomes a trap — the system appears to be running normally while every request waits an excessively long time.
3. Regional Load Spikes and the Noisy Neighbor Effect
Global Standard routes across regions. A burst of traffic from a specific region during a given period — such as bulk batch jobs from a large enterprise customer — can consume pool resources and impact other tenants. This "noisy neighbor effect" is difficult to fully avoid in multi-tenant shared architectures.
Four Key Strategies for Production Environments
Switch to Provisioned Throughput (PTU)
If your application is extremely latency-sensitive, the most fundamental solution is to adopt Provisioned Throughput Units (PTU) deployment. PTU reserves dedicated capacity exclusively for you, delivering predictable performance unaffected by shared pool fluctuations. The cost is higher and requires upfront capacity planning, but for core production workloads, that certainty is typically worth the investment.
Hybrid Deployment with Fallback Routing
A practical middle-ground approach is hybrid deployment: route critical requests through PTU while directing non-critical or latency-tolerant requests through Global Standard. Build multi-deployment fallback routing logic — when the primary deployment's latency exceeds a threshold, automatically redirect requests to a backup deployment (a different region, or even a different Data Zone Standard), improving overall resilience.
Set Sensible Timeouts and Retry Policies
This incident — where many requests "eventually completed but exceeded the application timeout" — highlights the need to revisit timeout strategies:
- Set timeouts based on specific business context rather than applying a blanket value
- Implement retry logic with exponential backoff, but be wary of retry amplification effects
- For streaming response scenarios, focus on Time to First Token (TTFT) rather than total completion time
Build a Proactive Latency Monitoring System
Don't rely solely on Resource Health and error codes. Instrument your application layer to continuously track P50/P95/P99 latency distributions. Only percentile-based latency monitoring and alerting can detect and surface issues quickly during incidents where everything looks error-free but performance has silently degraded.
Lessons for Engineering Teams
This seemingly routine latency incident reveals a broader engineering truth: when building production systems on multi-tenant shared cloud AI services, "no errors reported" does not equal "running well."
Performance predictability must be actively ensured through architectural design — you cannot rely on the shared resource pool always being lightly loaded. For teams embedding large language model capabilities into core business workflows, deeply understanding the trade-offs between Global Standard and Provisioned Throughput, and designing resilient fallback mechanisms accordingly, has become an unavoidable architectural competency.
Disclaimer: This article is based on a single developer's production experience shared in the community, as well as Microsoft's official public documentation on shared capacity. Actual behavior may vary by region, time of day, and workload characteristics. We recommend making decisions based on your own application's real monitoring data.
Related articles

The Truth Behind Codex 'Build a Website in 5 Minutes': AI Isn't Creating Sites—It's Helping You Copy Them
Exposing the truth behind viral Codex 5-minute website videos: creators aren't building original sites with AI—they're copying shared prompts or scraping others' work. Learn AI coding tools' real limits.

Getting Started with AI Agent Development: A Complete Guide from Concept to Practice
A comprehensive guide to AI Agent architecture and development, covering automated marketing, intelligent customer service, and investment analysis scenarios with single and multi-agent collaboration.

The Truth Behind Codex 'Build a Website in 5 Minutes': AI Isn't Creating Sites — It's Helping You Copy Them
Exposing the truth behind viral Codex 5-minute website videos: creators aren't building original sites with AI — they're copying shared prompts or scraping others' work.