IntelliJ IDEA Efficiency Configuration Guide: Lessons from Seven Years of Java Development

Seven years of IntelliJ IDEA configuration wisdom from a senior Java developer, from JVM tuning to AI-assisted debugging.
A senior Java developer shares a comprehensive IntelliJ IDEA configuration guide refined over seven years, covering JVM heap tuning for optimal performance, a layered AI-assisted coding strategy with Claude Code and MCP Skills, build-level formatting with Spotless, real database testing using Testcontainers, advanced debugging techniques like Mark Object and Drop Frame, and Spring-specific tools including the built-in HTTP Client.
As an experienced Java developer, your choice and configuration of IDE often determines your daily development efficiency and satisfaction. In a detailed video walkthrough, a senior developer broke down the IntelliJ IDEA configuration he's been refining for roughly seven years. Starting with NetBeans to learn Java, working with Eclipse for several years, and finally switching to IntelliJ — never looking back — the core philosophy behind this setup boils down to one thing: let the IDE handle everything you need while staying out of your way as much as possible.
This article distills that walkthrough into a practical and in-depth IntelliJ configuration guide, covering foundational settings, AI-assisted coding, code navigation, testing, debugging, and Spring ecosystem support.
IntelliJ IDEA Foundational Performance Tuning
Many developers install the IDE and jump straight into work, overlooking the most critical performance tuning. IntelliJ itself runs on the JVM, so configuring the Max Heap Size is essential.
The presenter bumped the default 2GB up to 8GB (by passing the -Xmx flag to the IDE itself — note this is separate from Gradle, the compiler, or your running application). Interestingly, even with 128GB of RAM on his machine, he sticks firmly to 8GB:
"Beyond 8GB, I haven't seen any performance improvement — in fact, GC pauses become noticeably longer. 8GB is the sweet spot between performance, fluidity, faster indexing, and search."
This touches on a core JVM garbage collection tradeoff: IntelliJ IDEA is itself a Java application running on the JVM. When the max heap is set too large (e.g., 16GB or higher), the garbage collector must scan and compact a significantly larger memory space, causing Full GC STW (Stop-The-World) pauses to grow longer. In an IDE context, this manifests as the editor suddenly freezing for hundreds of milliseconds or even seconds. 8GB is an empirical sweet spot: large enough to accommodate index data, symbol tables, and caches for large projects, yet not so large that GC becomes a burden. Modern JVMs (JDK 17+) default to G1 GC, which uses regionalized collection to control pause times, but larger heaps still require more time during Mixed GC phases to process old generation regions.
He also enabled the Memory Indicator to monitor memory usage in real time. When syncing Gradle, you can see the peak climb dynamically from 2200M to 2400M to 2600M — because Java adjusts memory allocation gradually rather than claiming the full 8GB upfront.
For the theme, he uses a custom one, and for the font, he keeps the default JetBrains Mono — because it's good enough that there's no reason to change it.
AI-Assisted Coding: A Layered Approach
This setup takes a notably restrained and layered approach to AI tools, which is well worth learning from.
Command-Line AI Tool Integration
For "pure prompt-based" coding, he opens Claude Code directly in the terminal, since his subscription plan offers generous allowances. He even configured the Claude command in settings as claude --dangerously-skip-permissions (bypassing permission confirmations) — self-deprecatingly calling this a "madman's" move.

A key detail: Claude Code uses the Java version configured in the project, not the system version, which avoids endless back-and-forth with the Agent about version issues. For Codex, since it supports using subscription plans within the IDE, he prefers running it in IntelliJ's integrated AI chat panel so he can observe changes in the IDE in real time.
Additionally, when launching an Agent from within IDEA, you can leverage bundled Skills (IDEA functionality exposed via MCP), such as IJ Debugger, which lets the Agent deeply explore Java runtime state. MCP (Model Context Protocol) is an open protocol introduced by Anthropic in late 2024, designed to standardize communication between AI models and external tools/data sources. In IntelliJ's context, MCP allows AI Agents to call the IDE's internal capabilities through a standardized interface — such as reading project structure, executing debug operations, triggering refactors, and more. These IDE capabilities exposed through MCP are called "Skills." For example, the IJ Debugger Skill enables AI Agents to set breakpoints, inspect variable values, and evaluate expressions. Essentially, it provides the IDE's debugging API to large language models in a structured way, allowing them to directly manipulate runtime state during a conversation rather than just generating code text.
Inline Code Completion and Command Completion
He doesn't hand all coding off to AI. Instead, he maintains the habit of writing code by hand in the editor, with AI primarily assisting through inline code completion — suggesting subsequent code based on context patterns, accepted with Tab.
Even more noteworthy is the Command Completion feature. When you can't remember a shortcut, typing .. at the end of a line brings up a range of actions: block comment, line comment, expand lambda, wrap in try-catch, extract method, generate code, wire Spring Bean, and more. This elegantly solves the pain point of not remembering the vast number of keyboard shortcuts.
Leveraging Live Templates for Faster Coding
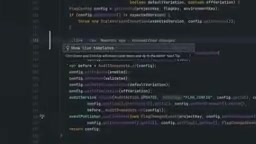
Beyond the obvious sout, there's soutv which prints both the variable name and its value simultaneously. Newer versions also support ..live to directly display available templates for the current context.
Code Formatting: From IDE Configuration to Build-Level Unification
Formatting is a frequent source of friction in team collaboration. His evolution here is quite representative:
Initially, he enabled Actions on Save, turning on "Reformat code" and "Optimize imports," and unified Java indentation, line wrapping, and brace rules in Code Style. Automatic formatting on every save ensured team-wide code consistency.
But later he discovered Spotless, whose core philosophy is to make "formatting live in the build, not in each person's IDE." Spotless is a multi-language code formatting Gradle/Maven plugin. Its core design philosophy elevates code formatting from "individual IDE configuration" to "a mandatory step in the build pipeline." The traditional approach relies on every developer configuring identical formatting rules in their IDE, but this inevitably leads to configuration drift — new team members forgetting to import settings, behavioral differences between IDE versions, etc. Spotless turns formatting into a deterministic operation through spotlessCheck (detecting formatting issues in CI) and spotlessApply (auto-fixing locally).
He also installed Palantir's Java formatter — finding it cleaner than Google Java Formatter and widely adopted by many teams. Palantir Java Format is a variant based on Google Java Format, maintained by Palantir Technologies. The main difference is a more aggressive line-breaking strategy for long lines, producing more visually compact code, and it's widely used in the fintech industry.
Important note: When using Palantir with Spotless, you must use IntelliJ's import ordering, because Palantir itself doesn't handle import sorting — otherwise Spotless will fail due to incorrect import order.
Efficient Code Navigation and Refactoring Tips
Navigation experience is a key differentiator for any IDE.
- Double-tap Shift (Search Everywhere): Search for classes, files, symbols, actions, and plugins. Type
/to see all commands. This is his most-used entry point. - Key Promoter X plugin: When you click a feature with the mouse, it pops up the corresponding keyboard shortcut (e.g., Terminal is Alt+F12). Because the popups are annoying, they actually motivate you to learn shortcuts.
- Git Toolbox: Provides inline Git status, showing the author, timestamp, and associated commit for each line of code.
Regarding renaming, Shift+F6 (Rename Refactoring) far surpasses plain find-and-replace. If two classes both have a count field, a regular replace would affect both, while Rename Refactoring precisely identifies scope and only modifies references within the target class.
This precision stems from IntelliJ's comprehensive semantic analysis: the IDE maintains a complete PSI (Program Structure Interface) tree behind the scenes — IntelliJ's structured representation of source code, containing type inference, scope chains, inheritance relationships, and more. When you rename a field, the IDE traverses all nodes in the PSI tree that reference that symbol, using the resolve mechanism to confirm whether each reference actually points to the target symbol. This means even when identically named fields exist in different classes, the IDE can accurately distinguish them through the type system, avoiding unintended modifications.
Testing Strategy: Real Database Testing with Testcontainers
For testing, he runs tests directly from the editor's gutter, with options to run the entire class or individual methods, and after fixing issues, re-run only the fixed portion.
He configured two separate run configurations: one for fast unit tests (which can run while writing code) and another for slower integration tests, achieving fast/slow separation.
The most interesting part is his use of Testcontainers — integration tests spin up a real PostgreSQL Docker container, which is discarded after the run. Testcontainers is a Java library that uses the Docker API to start and destroy containerized dependency services (databases, message queues, caches, etc.) on demand during the test lifecycle. Its core advantage is test isolation: each test run gets a fresh, clean database instance, eliminating state pollution between tests.
In Spring Boot, a single @ServiceConnection annotation handles the wiring. @ServiceConnection is an annotation introduced in Spring Boot 3.1+ that automatically detects the container port started by Testcontainers and injects the connection information into Spring's Environment, eliminating the need for developers to manually configure properties like spring.datasource.url. Compared to mock solutions using in-memory databases like H2, real database testing catches SQL dialect differences, constraint violations, transaction isolation level issues, and other problems that would only surface in production.
"The reason I use a real database instead of mock repositories is that I've actually written bugs in the data layer — they can fool mocks, but almost none of them can fool a real database."
Combined with the Randomness plugin (Alt+R), you can directly insert random UUIDs and other test data, saving the hassle of constructing sample values.
Advanced IntelliJ Debugging: Easily Overlooked Power Features
The debugging workflow contains quite a few hidden gems:
- Disable rather than delete breakpoints: Middle-click a breakpoint to disable it, preserving its conditions without losing them.
- Mark Object: A powerful tool for tracking stateful bugs. When a particular object goes wrong during batch processing, mark it with F11 and give it a name (e.g.,
target audit service), then set it as a breakpoint condition — the debugger will only stop on that specific object. - Drop Frame: If you accidentally step one line too far and miss your observation point, you don't need to restart the application to reproduce the bug — you can rewind the call stack to before the method call.
Drop Frame is a capability provided by the JVM Debug Wire Protocol (JDWP). It works by discarding the current method's stack frame and rewinding the program counter (PC) to the caller's call site. From the JVM's perspective, this is equivalent to "pretending" the current method was never called — local variables are discarded and execution flow returns to the bytecode position before the method invocation. However, there's an important caveat: all side effects that have already occurred (database writes, network requests, file modifications, static variable changes, heap object state mutations) will not be rolled back. Therefore, it's best suited for "re-observing pure computational logic" rather than debugging scenarios that require complete state rollback.

Newer versions also introduce the IJ Debugger Skill, which lets AI Agents automatically perform most of the debugging operations described above. Additionally, Local History acts as a Git-like history built into IntelliJ — even uncommitted changes can be viewed and reverted version by version.
Spring Development-Specific Toolchain
As a Spring developer, he highlighted several dedicated tools:
- Spring Debugger: Displays which Beans are actually injected through inline hints, with direct navigation to Bean definitions.
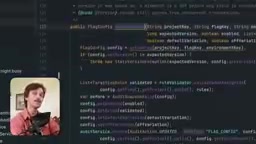
- Built-in HTTP Client: The globe icon next to mapping annotations lets you generate an HTTP request file for that endpoint with a single click (plain text, committable to your repo). Combined with environment files, you can switch between local and staging environments — an in-editor alternative to Postman.
IntelliJ's built-in HTTP Client uses .http or .rest plain text files to describe HTTP requests, supporting variable substitution, environment switching, response assertions, and script processing. Compared to GUI tools like Postman, its core advantage is "configuration as code" — request files can be stored directly in a Git repository, versioned alongside API code, without team members needing to import Collections or sync cloud workspaces. Environment files (http-client.env.json) define variable values for different environments (such as base URL, token) in JSON format, and switching environments requires only selecting the corresponding configuration. This approach is particularly well-suited for microservice development scenarios, where each service's repository comes with its own API test requests — new team members can start debugging endpoints immediately after cloning the repo.
- JPA Buddy: Generates entities or DTOs faster than writing by hand, kept as a convenience tool.
Recommended IntelliJ Utility Plugins
Finally, a few more plugins that enhance the experience:
- SonarQube for IDE (formerly SonarLint): Inline code review that detects bugs, code smells, and anomalous patterns in real time.
- Maven Helper: Analyzes dependencies and troubleshoots version conflicts.
- String Manipulation: Right-click to quickly convert naming formats (e.g., batch convert to camelCase, CONSTANT_CASE, etc.).
- .ignore: Generates and manages gitignore files with syntax support.
Conclusion: A Systematic Configuration Mindset
The value of this configuration isn't that every feature is groundbreaking — many settings are actually quite basic. The real insight lies in the systematic approach: first tune the underlying performance, then introduce AI assistance in layers, unify formatting at the build level, ensure test reliability with real containers, and make the most of those debugging and navigation power features "hidden in the corners."
Seven years of refinement prove that a great IDE configuration isn't about piling on features — it's about letting the tools quietly fade into the background so developers can focus on what truly matters: writing reliable code.
Related articles

The Era of AI Capability Overhang: Why You Need to Reset Your Ambition Every 3 Months
Understanding Capability Overhang in the AI era: when model capabilities far exceed application imagination, how teams should reset feasibility boundaries quarterly to avoid ceding advantages to competitors.

Firemaps Spain: Real-Time Wildfire Monitoring Map with Wind Flow Visualization
Firemaps Spain is an open-source real-time wildfire monitoring tool for Spain and Portugal, combining fire hotspot data with wind flow visualization to help assess fire spread direction.

Google AI Studio Hiring TPM Lead: Decoding the Three Key Criteria Including 'AI Pilled'
Google DeepMind's AI Studio team is hiring a TPM lead with three key criteria: AI pilled, high agency, and pushing the frontier. A deep dive into Google's acceleration strategy and AI talent trends.