A Real-Time Solar System in Your Browser: 526,000 Asteroids and Every Tracked Satellite

A browser-based real-time solar system visualizing 526k asteroids and every tracked satellite.
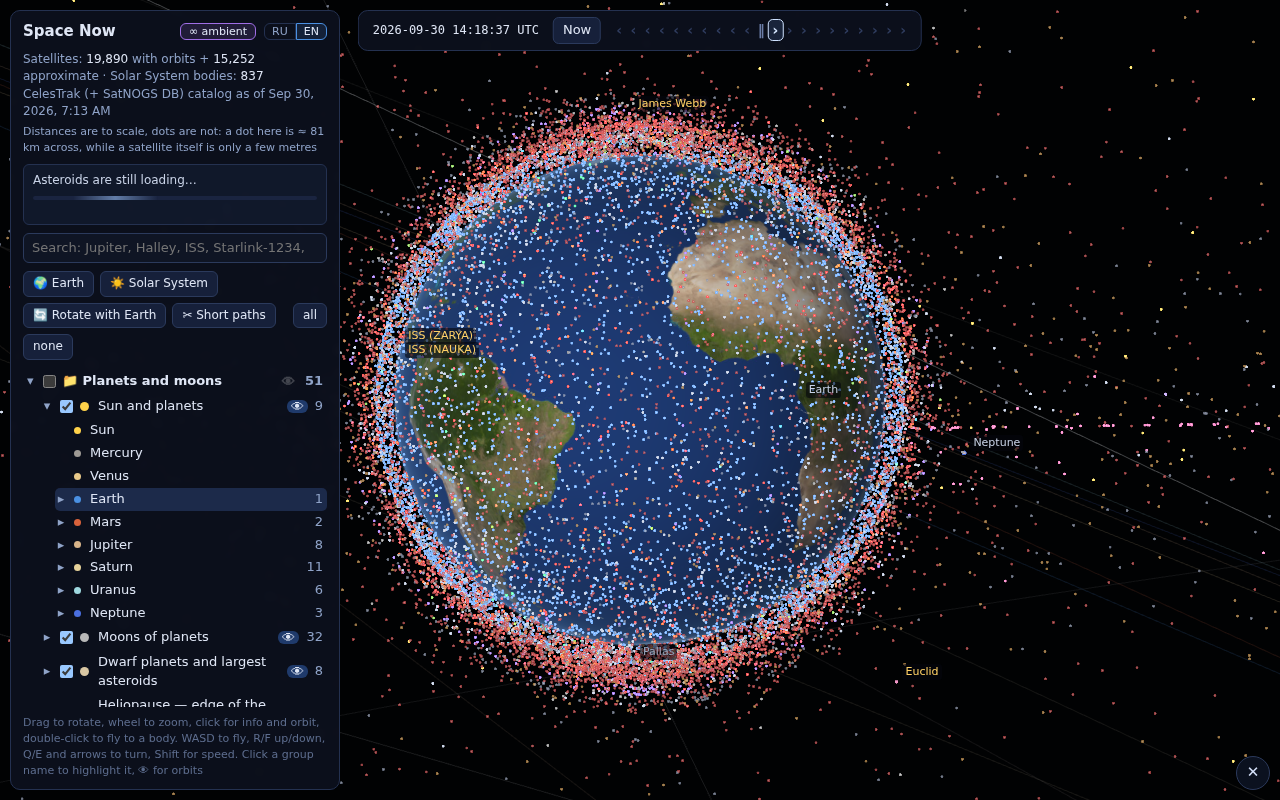
space.bl2.net is an open-source, browser-based real-time solar system visualization that earned 295 points and 73 comments on Hacker News. It simultaneously renders over 526,000 known asteroids and all trackable artificial satellites, with positions continuously calculated from orbital parameters. The project relies on WebGL instanced rendering, TLE/SGP4 models for satellites, and Keplerian elements for asteroids — unifying two very different data sources into a single coordinate system. It showcases what's possible when public astronomical data meets modern browser graphics capabilities.
An open-source visualization project called space.bl2.net made it to the front page of Hacker News, quickly racking up 295 points and 73 comments. Its core appeal is straightforward: build a real-time solar system model in the browser that simultaneously renders 526,000 known asteroids and every tracked artificial satellite. For astronomy enthusiasts and web graphics developers alike, it's a project that's as technically impressive as it is visually stunning.
A Solar System Running in Your Browser
What makes this project stand out is the combination of data scale and real-time accuracy. Traditional solar system visualizations typically show only the eight planets and a handful of notable objects. space.bl2.net pulls in the vast majority of the known asteroid belt — over 520,000 objects — and layers on the current orbital data for all trackable artificial satellites.
"Real-time" is the key word here. The positions of objects in the model aren't static placeholders; they're continuously calculated from orbital parameters to reflect where each body actually is at any given moment. When you open the page, what you see is, in theory, an approximate snapshot of the solar system's current configuration. This fusion of astronomical data, orbital mechanics, and web-based rendering is exactly why it caught the attention of the tech community.
The Technical Challenges of Rendering Massive Numbers of Objects
Drawing hundreds of thousands of moving objects simultaneously in a browser is a serious engineering challenge. 526,000 asteroids means processing an enormous number of coordinate calculations and draw calls every single frame. Techniques like WebGL and GPU instanced rendering are essentially required to maintain a reasonable frame rate at this object density.
Handling the orbital data is equally tricky. Satellite positions are typically derived from TLE (Two-Line Element) sets using propagation models like SGP4, while asteroids rely on their individual Keplerian orbital elements. Unifying two completely different data sources — with different origins, different precision levels, and different update frequencies — into a single coordinate system and timeline while keeping the visuals coherent represents a significant amount of work behind the scenes.
For front-end developers, projects like this are valuable not just because they look great, but because they demonstrate the browser's potential as a high-performance visualization platform. Scientific visualizations that once required dedicated desktop software can now run smoothly in a web page.
TLE (Two-Line Element Set) is a standard orbital data format maintained by US Space Command (USSPACECOM). It encodes a satellite's orbital parameters — including inclination, eccentricity, right ascension of the ascending node, and other Keplerian elements — in two fixed-width lines of ASCII text. SGP4 (Simplified General Perturbations 4) is the propagation model paired with TLE data. It builds on a basic Keplerian elliptical orbit by adding perturbation terms for atmospheric drag and Earth's non-spherical gravity (J2 perturbation), allowing TLE data to be extrapolated to a satellite's position and velocity at any given time. TLE data is typically updated one to several times per day, and propagation errors accumulate over time — a fresh TLE can be accurate to within kilometers over a few hours, but errors grow significantly beyond a few days. For real-time visualization projects like space.bl2.net, regularly pulling the latest TLE data from public sources like Space-Track.org or Celestrak is essential for maintaining approximate positional accuracy.
Why Show HN Projects Like This Are Worth Paying Attention To
Hacker News's "Show HN" section has always been a window into what developers are building, and projects that score close to 300 points tend to share three qualities: technical depth, an immediately compelling presentation, and a sense of awe you can actually see. Solar system visualizations hit all three — the astronomical scale of the data delivers a natural visual impact, and the graphics and data engineering required to pull it off earns respect from fellow developers.
From a broader perspective, projects like this reflect the open-source community's ongoing exploration of scientific data visualization. Publicly available orbital data — such as NASA/JPL's asteroid database and publicly released TLE data from satellite tracking organizations — gives independent developers the raw material they need. Meanwhile, the ever-improving graphics capabilities of modern browsers lower the barrier to presentation. Together, they enable individual developers to produce visualization experiences that once required professional institutions to deliver.
The NASA/JPL Small-Body Database (SBDB) is the most authoritative source of asteroid and comet orbital data, maintained by JPL's Solar System Dynamics group (SSD). It currently catalogs orbital solutions for over 1.3 million known small bodies. The vast majority of entries come from sky survey programs such as the Catalina Sky Survey (CSS), Pan-STARRS, and ATLAS — automated telescope systems that add tens of thousands of new orbital records each year. The database stores data primarily in the form of six Keplerian orbital elements (semi-major axis, eccentricity, inclination, right ascension of the ascending node, argument of perihelion, and epoch), with planetary gravitational perturbations corrected through numerical integration. The 526,000 asteroids displayed on space.bl2.net correspond to the subset of this database with sufficiently high-quality orbital solutions for visualization purposes; their three-dimensional positions in ecliptic coordinates are calculated in real time using the Kepler equation.
Conclusion
space.bl2.net is a remarkably complete visualization project that weaves together astronomical data, orbital mechanics, and web graphics technology. The real-time rendering of 526,000 asteroids alongside every tracked satellite in orbit is both a stress test of browser performance and an accessible window into just how busy our solar system actually is. Whether you're interested in WebGL, data visualization, or astronomy outreach, it's well worth a look.
Note: This article is based on information from the project's Hacker News submission. For specific technical implementation details, refer to the project page at space.bl2.net.
Related articles

Gemini 4 Argon Hands-On: AI Builds Board Games, Constructs Temples, and Trains Robots Autonomously
Gemini 4 Argon hands-on roundup: AI autonomously builds a desk racetrack and temple in Blender, writes a ray tracing engine, trains a humanoid robot to sink 7 shots, plus API pricing and developer access.

The Magic Octagonal Coin: Why Only 9% of People Can Predict Its Flip?
Only 9% of people can correctly predict the Magic Octagon coin flip. This article explains its spatial rotation mechanism, common cognitive pitfalls, and a new hypothesis based on Relevance Theory, exploring the limits of human spatial reasoning.

Sam Altman: AI Is Entering the Era of Scientific Discovery — Math Breakthroughs Will Replicate in Biology and Energy
Sam Altman says AI is entering the era of scientific discovery — math breakthroughs will replicate in biology, materials science, and energy to help develop new drugs and energy sources.