Agent Tracing Explained: See Every Step of Your AI Agent

Agent tracing uses tree-shaped spans to record every agent step, solving what logs can't: locating slow, costly, and wrong behavior.
The article explains that ordinary logs can't express the causal relationships in an agent's multi-step execution, whereas agent tracing records a run as a tree-shaped trace, with each span corresponding to a step (model call, tool call, etc.) and storing the model, inputs and outputs, token counts, and errors. The timeline locates slow steps, summing tokens locates high-cost calls, and inspecting model inputs and tool returns locates the root cause of wrong answers. OpenAI Agent SDK records inputs and outputs by default, while OpenTelemetry GenAI conventions require active opt-in—opposite privacy defaults. Adopting the OTel standard avoids vendor lock-in. Ultimately, tracing should be linked with evals so that when a test fails, the trace directly reveals why—it's the infrastructure that makes agents maintainable.
Your AI agent gave a customer a wrong answer—but which step went wrong? Without tracing, you may never find out. Agent tracing records every action an agent takes during a single run—every model call, every tool call, every decision. It's not just a pile of logs; it links the agent's multi-step execution into a traceable tree.
Why ordinary logs aren't enough
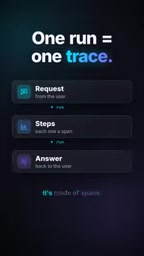
Ordinary logs are just lines of text recording "what happened." But an agent's run is multi-step: a user request comes in, the model thinks, calls a tool, gets a result, calls the model again, and finally produces an answer. These steps have causal relationships, and plain-text logs can't express "who triggered whom." According to the video explanation, the core value of agent tracing is connecting these steps so you can see the full picture of a complete run.
Trace and Span: the basic structure of an agent run
A trace represents one complete run, from the user request to the final answer. It consists of multiple spans. Each span is a step, with a start time and an end time, plus a parent node—so all the steps form a tree.
Take a typical agent run: the root node is the agent run itself; beneath it are a model call, a tool call, and another model call. Each span stores the key information needed for debugging—the model used, inputs and outputs, token counts, and any errors. This tree structure makes causality obvious at a glance, instead of guessing from timestamps in a sea of logs.
Three questions tracing answers directly
Why is the agent slow?
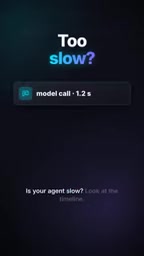
Look at the timeline. In the video's example, you can directly see which step took eight seconds. No need to scan logs line by line—the timeline visualizes each span's duration, so the bottleneck step is immediately exposed.
Why is the agent expensive?
Add up the token counts in each span to find the call that consumed the most budget. Cost analysis is no longer guesswork—it's attributed step by step.
Why is the answer wrong?
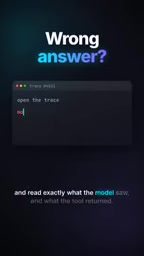
Open the trace and read exactly what the model saw at the time, and what the tool returned. According to the video, the root cause of a wrong answer is often hidden in the input to a particular model call, or in the return value of a particular tool call.
Framework support out of the box and industry standards
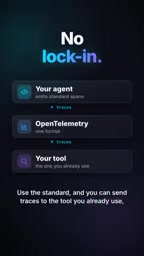
Many agent frameworks include tracing by default. OpenAI's Agent SDK, for example, records model calls, tool calls, handoffs, and guardrails. Meanwhile, OpenTelemetry's GenAI semantic conventions are becoming a cross-framework standard—still under development—defining span types such as InvokeAgent and ExecuteTool.
The benefit of adopting a standard is avoiding lock-in: you can send traces to the observability tools you already use, rather than being tied to one vendor's platform.
OpenTelemetry and the GenAI semantic conventions
OpenTelemetry (OTel) is an open-source, vendor-neutral observability framework that unifies the collection and export standards for traces, metrics, and logs. Its Semantic Conventions for Generative AI are specifications created specifically for generative AI applications, defining how to map model calls, tool executions, agent handoffs, and other operations into standard span types and attributes, such as gen_ai.agent.invoke and gen_ai.tool.execute. Following these conventions means your trace data can be consumed directly by any OTel-compatible backend (such as Jaeger, Prometheus, Datadog, etc.) without adapting separately for each observability platform. The specification is still under active development, but it has already become an important direction for cross-framework interoperability.
handoff and guardrails
In the OpenAI Agent SDK, handoff refers to the mechanism by which an agent hands off a task or conversation control to another agent, commonly used in multi-agent collaboration scenarios; guardrails are safety rails set around model inputs and outputs, such as content filtering, format validation, or sensitive information blocking. Tracing records these events as separate spans too, helping developers audit handoff paths between agents and when safety policies are triggered.
Privacy defaults: two opposite designs
Traces may contain user data, which is a must-consider when choosing tools. The video points out that OpenAI's SDK records inputs and outputs by default—if you handle sensitive data, you need to turn this off actively. OpenTelemetry does the opposite: message content is captured only when you explicitly opt in. Neither default is inherently better, but teams need to know what their tool's default behavior is.
Connecting traces to evals
The ultimate value of tracing lies in connecting it with evals. When a test case fails, the trace tells you directly why it failed. One line from the video captures the essence: "If you can't see it, you can't fix it." For agent developers, tracing isn't an optional debugging aid—it's the infrastructure that makes the system maintainable.
The link between evals and tracing
Evals refers to the process of automatically running an agent with a set of predefined test cases (such as question-answer pairs or task scenarios) and scoring it based on metrics like accuracy, relevance, and safety. Combining traces with evals means each test case execution generates a complete trace. When a case scores low or fails, developers don't have to guess the cause from the final output alone—they can drill down to specific spans: see what context the model saw in a given round, what data the tool returned, and which step was abnormally slow or errored. This closed loop of "evals trigger, traces locate" turns after-the-fact debugging into repeatable root-cause analysis, significantly improving the efficiency of agent iteration.
One-line Summary
Agent tracing uses a tree of spans to record every step of an agent, solving the problem that logs can't locate slow, expensive, or wrong behavior.
Paragraph Summary
The article points out that ordinary logs can't express the causal relationships in an agent's multi-step execution, whereas agent tracing records a run as a tree-shaped trace, with each span corresponding to a step (model call, tool call, etc.) and storing the model, inputs and outputs, token counts, and error information. The timeline locates slow steps, summing tokens locates high-cost calls, and inspecting model inputs and tool return values locates the root cause of wrong answers. OpenAI Agent SDK records inputs and outputs by default, while OpenTelemetry GenAI conventions require active opt-in—opposite privacy defaults. Adopting the OTel standard avoids vendor lock-in. Ultimately, tracing should be linked with evals so that when a test fails, the trace directly reveals why—it's the infrastructure that makes agents maintainable.
Related articles

VERS: Editing Activation Explanations to Halve Reasoning Model Tokens
VERS guides reasoning models by editing activation explanations, cutting 45.8% of tokens on GSM8K with only a 0.82 pp accuracy drop and transferring to larger models, but losing accuracy on competition problems.

Finding Errors Is Not Enough: Selective Model Escalation for Entity-Targeted Sentiment Analysis
This study explores selective model escalation for entity-targeted sentiment analysis, comparing data collection ordering, uncertainty-driven re-examination, and model routing—finding that minority-class priority only helps at very small data volumes, the oracle upper bound far exceeds actual gains, and escalation must be tailored to each dataset.
WAS-PO: Using Whitened Advantages to Solve the Correlation Trap in Multi-Reward Reinforcement Learning
WAS-PO paper proposes whitening advantages to correct correlation bias in multi-reward RL: when rewards are correlated, naive weighted summation effectively applies Σ^{1/2}w instead of w. Experiments show training reward improves steadily, but held-out accuracy does not improve in sync, and under two rewards it actually falls behind.