AI Crop Pest & Disease Early Warning System: A Detailed RAG + Agent Implementation Guide for Graduation Projects

A detailed technical breakdown of five core modules in an AI crop pest early warning system
This article presents an AI crop pest and disease early warning system combining LLM-based RAG and Agent technology, covering five modules: pest identification, animal/plant recognition, data center, detailed query, and meteorological monitoring. The system uses deep learning models for image recognition, ECharts for data visualization, and RAG technology to build a vector knowledge base for professional pest control knowledge retrieval, forming a complete agricultural warning solution from identification to decision-making.
Project Overview: Five Core Modules for a Complete Pest & Disease Warning System
AI applications in agriculture are becoming increasingly widespread, and intelligent crop pest and disease identification has become a popular thesis topic in recent years. The "AI Crop Pest & Disease Early Warning System" presented in this article combines LLM-based RAG (Retrieval-Augmented Generation) with Agent technology to build a comprehensive warning solution that spans from image recognition to data analysis and meteorological monitoring.
The system consists of five core modules: Pest & Disease Identification, Animal & Plant Recognition, Data Center, Detailed Data Query, and Meteorological Monitoring, covering all critical aspects of agricultural pest and disease prevention. Let's break down the functional design and technical implementation of each module.
Pest & Disease and Animal/Plant Intelligent Recognition Module
Insect Identification
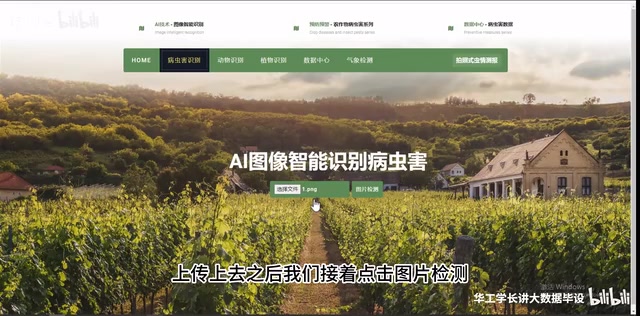
Pest and disease identification serves as the system's most critical entry point. Users upload an insect image, click the "Image Detection" button, and the system automatically completes the analysis, outputting detection results including insect species and basic characteristics.
The underlying implementation typically relies on deep learning image classification models (such as ResNet, EfficientNet, etc.), trained on agriculture-specific pest and disease datasets. ResNet (Residual Network) was proposed by Kaiming He's team at Microsoft Research in 2015, solving the vanishing gradient problem in deep network training through "residual connections" — a milestone architecture in computer vision. EfficientNet, proposed by Google Brain in 2019, optimizes network depth, width, and resolution simultaneously through a compound scaling strategy, achieving higher accuracy with fewer parameters, making it particularly suitable for resource-constrained deployment scenarios. For agricultural pest identification tasks, transfer learning is typically employed: starting with ImageNet pre-trained weights and fine-tuning on agriculture-specific datasets (such as the IP102 dataset containing over 75,000 images across 102 insect classes). This approach achieves high recognition accuracy with relatively less training data, significantly lowering the data and computational barriers of training from scratch.
Animal and Plant Recognition
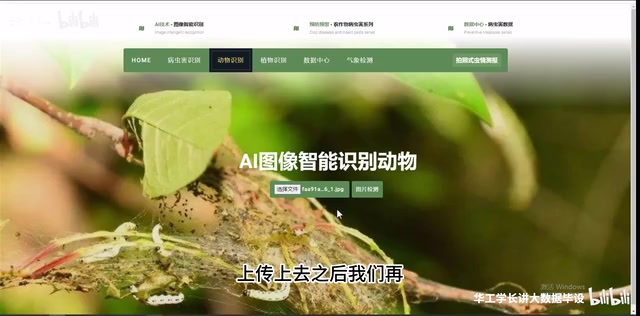
Beyond insect identification, the system also supports animal and plant recognition. The workflow is identical — upload an image, click detect, and get results. For example, after uploading an animal photo, the system can accurately identify the breed (e.g., "Japanese Village Dog") and provide detailed species information.
There are two common approaches to implementing this multi-category recognition capability:
- Direct recognition via multimodal LLMs: Leveraging the visual understanding capabilities of large models for image classification
- API + RAG knowledge enhancement: Calling image recognition APIs from platforms like Baidu AI or Alibaba Cloud for basic classification results, then using RAG technology to retrieve supplementary species information from a knowledge base
Both approaches achieve the dual output effect of "recognition + knowledge enhancement." The specific choice depends on the project's performance requirements and budget constraints.
Data Center and Visual Analytics Module
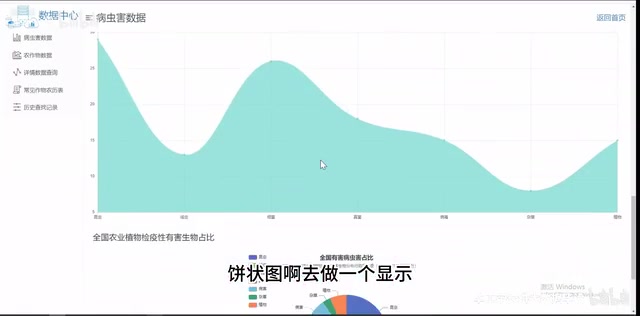
The Data Center serves as the system's "brain," responsible for aggregating and displaying all pest and disease-related data. The system provides multiple visualization charts:
- Line charts: Showing trends in pest and disease occurrence over time
- Bar charts: Comparing pest and disease counts across different regions or species
- Pie charts: Displaying the proportional distribution of various pest and disease types
Crop yield, planting area, and other data are also presented visually through charts, helping users quickly grasp the overall situation.
On the technical side, front-end visualization typically uses ECharts or AntV charting libraries. ECharts is an open-source JavaScript visualization library originally developed by Baidu and now maintained by the Apache Software Foundation. It supports dozens of chart types including line charts, bar charts, pie charts, heatmaps, and maps, powered by dual Canvas and SVG rendering engines with excellent performance under large data volumes, and has mature integration solutions with mainstream front-end frameworks like Vue and React. Notably, ECharts' map component is particularly useful in agricultural scenarios — it can combine pest occurrence data with geographic information to generate provincial/city-level pest distribution heatmaps, visually presenting regional outbreak patterns. The backend stores historical detection records in a database, performs statistical aggregation, and returns data to the frontend for rendering. This data-driven design transforms the system from a simple "recognition tool" into an agricultural decision-support platform with data analysis capabilities.
Detailed Query and RAG Knowledge Base Module
Pest & Disease Knowledge Retrieval
The system includes a built-in database of common insects and pest diseases, allowing users to quickly search for specific pest information. Query content covers:
- Pest name and taxonomic classification
- Detailed description of damage symptoms
- Recommended prevention methods and pesticide suggestions
- Affected crop types and scope
This is the most typical application scenario for RAG (Retrieval-Augmented Generation) technology. RAG was formally proposed by Meta AI's research team in 2020 in the paper Retrieval-Augmented Generation for Knowledge-Intensive NLP Tasks. Its core idea is to decouple and chain two steps — "information retrieval" and "text generation": first retrieving the most relevant document fragments from an external knowledge base, then feeding these fragments as context to a large language model to guide it in generating more accurate, evidence-based responses.
The system builds agricultural pest and disease professional materials into a vector knowledge base — using an Embedding Model to convert text into high-dimensional vectors stored in databases optimized for vector retrieval. During queries, the user's question is also converted into a vector, and the semantically closest knowledge fragments are found by calculating cosine similarity — a process called "Approximate Nearest Neighbor search (ANN)." Popular vector databases include: Milvus (open-source, supports billion-scale vector retrieval, suitable for production environments), FAISS (Meta's open-source high-performance retrieval library, suitable for small-to-medium scale scenarios), and Chroma (lightweight, suitable for rapid prototyping). For graduation projects, Chroma or FAISS are more beginner-friendly choices, while Milvus is better suited for demonstrating engineering capabilities.
Compared to pure LLM generation
Related articles
 Tutorials
ChatGPT Plus Subscription Guide: Are GPT-5.5, image-2, and Codex Worth the Upgrade?
A detailed look at ChatGPT Plus features — GPT-5.5, image-2, and Codex — with a Plus vs Pro comparison and a complete step-by-step subscription guide for users outside the US.
 Tutorials
Harness AI Engineering in Practice: Using Claude Code to Master Enterprise-Level E-Commerce Development
Deep dive into Harness AI Engineering: master enterprise e-commerce development with Claude Code using the Rules, Skills, Wiki, and Changes framework.
 Tutorials
Cursor + Codex Dual-IDE Collaboration: A Practical Methodology for Open-Source Project Customization
A complete methodology for open-source project customization based on real-world experience, detailing the Cursor+Codex dual-IDE workflow, seven-stage process, MVP validation, and AI source code reading techniques.