AI Project Evaluation Framework: A Practical Guide to 5 Levels and 30 Key Metrics

A five-layer, thirty-metric evaluation framework for production AI/LLM Agent projects.
This article presents a systematic AI product evaluation framework spanning five levels—Model Quality, User Experience, System Efficiency, Business Value, and Data Feedback Loop—with 30 metrics total. The framework answers three core questions: Is AI smart enough, cheap enough, and able to generate profit while continuously evolving? It emphasizes that quantification is the prerequisite for optimization and that iteration speed is the true moat in the AI era.
When enterprises truly push their LLM Agent projects into production, one unavoidable core question surfaces: How do you scientifically evaluate an AI product's performance? Whether you're a product lead, architect, or product manager, you need a systematic evaluation framework to quantify output and drive optimization.
Based on hands-on experience, this article presents a complete evaluation system spanning from technical to commercial dimensions—5 levels, 30 metrics—to help you maintain full control over your AI project's quality and value.
Quantification Is the Prerequisite for Optimization: The Underlying Logic of AI Evaluation
The primary mission of evaluation is quantification. Only by converting AI product performance into measurable values can you identify optimization directions. Without quantification, there is no optimization.
A successful AI project must overcome three major challenges:
- Accuracy challenge: The AI product itself must be reliable, providing genuinely valuable help to users
- Cost challenge: AI's marginal cost is far higher than traditional internet products—Token consumption is a very real expense
- Survival challenge: Products need continuous iteration and optimization; agile development capability is crucial
These three points form the underlying logic of AI project evaluation. Unlike internet products with near-zero marginal costs, every AI call consumes computing resources, which means we must focus on both quality and efficiency simultaneously.
Overview of the Five-Layer Evaluation Framework
The entire evaluation system is divided into five levels, each corresponding to a different capability dimension:
| Level | Core Capability | Objective |
|---|---|---|
| Model Quality Layer | Algorithm capability | Make AI smart enough |
| User Experience Layer | Product capability | Make AI easy and pleasant to use |
| System Efficiency Layer | Engineering capability | Make AI cheap and fast |
| Business Value Layer | Commercial capability | Make AI profitable |
| Data Feedback Loop Layer | Iteration capability | Enable AI self-evolution |

Let's break down the core metrics for each level.
Level 1: Model Quality Layer—The Foundation Determines the Height
Model quality is the product's foundation. If algorithmic capability is insufficient, everything else is built on sand.
Resolution Rate
The proportion of user problems that AI independently resolves. Experience shows 60%-80% for customer service scenarios and about 30%-50% for complex business scenarios. Don't have unrealistic expectations—a 95% resolution rate is not feasible under current technical conditions.
Hallucination Rate vs. No-Answer Rate
These are a classic pair of "seesaw" metrics:
- Hallucination rate: The proportion of fabricated answers. Should not exceed 15% for general conversation scenarios, and must stay below 1% for vertical domains (such as quotes, contracts, etc.)
- No-answer rate: The proportion of times AI responds with "I don't know." This represents a conservative strategy—when uncertain, don't answer
Both fundamentally stem from the model lacking relevant knowledge. Loading external knowledge bases through RAG can reduce both metrics simultaneously. However, when external knowledge is fixed, they have an inverse relationship—lowering the hallucination rate often means the no-answer rate rises, and vice versa.
Intent Recognition Accuracy
In agent architectures, user input needs to be routed to the correct subsystem (e.g., track delivery, process refund, check weather, etc.). Intent recognition accuracy typically ranges from 85%-95%. It's the starting point of the entire pipeline—if this step goes wrong, everything downstream is wasted.
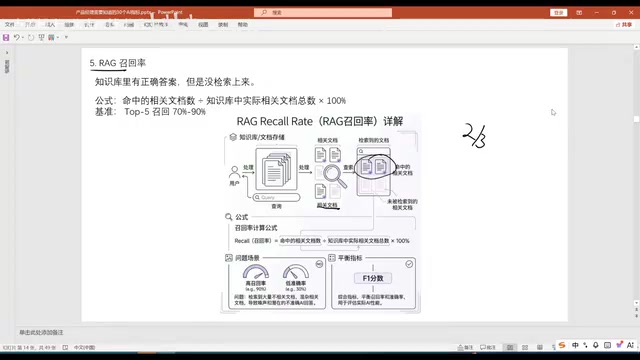
Two Key Metrics for RAG Systems
RAG (Retrieval-Augmented Generation) systems have two core metrics that require special attention:
- Recall rate: The proportion of relevant documents in the knowledge base that are successfully retrieved. Recall must be prioritized because knowledge that isn't retrieved cannot be compensated for in subsequent steps
- Factual consistency: After correct documents are recalled, whether the model can generate accurate answers based on them. Should be above 85%; otherwise, consider switching to a more capable base model
There's an important principle in practice: When you find answers are incorrect, don't blindly switch models. First analyze whether retrieval failed or whether retrieval succeeded but the model couldn't comprehend the content, then optimize accordingly.

Level 2: User Experience Layer—What Users Actually Perceive
If model quality is the foundation buried underground, user experience is the building's exterior—the part users directly perceive.
First-Turn Satisfaction
The proportion of problems solved in a single exchange. Excellent products should exceed 65%, with a passing threshold of 45%. Repeated interactions not only damage user experience but also significantly increase Token costs.
Human Handoff Rate
The proportion of user inquiries transferred to human agents—15%-30% is an acceptable range.
There's a common trap here: Don't hide the human handoff option just to lower this metric. The numbers may look better on the surface, but users might simply churn instead. Human handoff rate is not a negative metric—in AI's early stages, when the system can't answer a question, it shouldn't force an answer, and certainly shouldn't mislead users.
Task Completion Rate and Code Acceptance Rate
- Task completion rate: The proportion of proactive tasks initiated by agents (such as form filling, expense reports, etc.) that are ultimately completed—generally should exceed 40%
- Code acceptance rate: The proportion of AI-generated code accepted by developers—current industry level is around 30%. You might not realize that an abnormally high acceptance rate isn't necessarily good—it could mean developers are accepting everything without scrutiny
Multi-Turn Dialogue Completion Rate
When issues aren't resolved in a single turn and enter multi-turn dialogue, the biggest challenge is context window truncation. As conversation turns increase and context grows longer, intent drift becomes likely. Generally should exceed 60%.

Level 3: System Efficiency Layer—Spending Tokens Where They Matter
This level determines how much it costs to solve each problem and represents the most fundamental difference between AI products and traditional internet products.
Four Approaches to Token Cost Control
- Streamline prompts: Don't write overly long system prompts (this is a major reason why products like Cursor burn through money)
- KV Cache: Fixed header prompts can be cached and reused to avoid redundant computation
- Tiered model invocation: Use smaller models when they're sufficient—don't deploy maximum computing power for simple questions
- Context management: Compress unnecessary conversation history to reduce redundant Tokens
Response Speed Metrics
- TTFT (Time to First Token): The time to generate the first Token, directly impacting the user's waiting experience
- End-to-end latency: Total time from the first Token to the last Token. In agent scenarios, tool calls can significantly increase latency—optimize through parallel invocation
Token Usage Efficiency
An easily overlooked metric. If a user's question is only 50 Tokens, the answer is 200 Tokens, but massive Token consumption goes to redundant prompts and imprecise RAG retrieval, the actual effective Token ratio is very low. The optimization direction is clear: streamline prompts + improve RAG retrieval accuracy.
System Availability and Multi-Vendor Strategy
Don't bind yourself to a single model provider. External APIs can experience timeouts, degradation, or even outages. Product architecture should support multi-vendor switching to avoid being held hostage by any single provider. Additionally, keep systems as vendor-agnostic as possible—don't over-customize for one specific model to the point where migration becomes difficult.
Level 4: Business Value Layer—Profitability Is the Bottom Line
No matter how impressive the technical metrics are, everything ultimately comes back to commercial value.
AI Feature Adoption Rate
The key metric is repeat usage rate—the proportion of users who return within 7 days after first use. Many users click out of curiosity and never come back; this "novelty sampling" doesn't count as genuine adoption.
Unit Resolution Cost
The AI cost vs. human cost of solving one problem. Here's a vivid analogy: Many people in India still wash clothes by hand because labor costs are so low that buying a washing machine is actually less economical. AI is developing rapidly in China and the US largely because labor costs continue to rise, making the economic case for AI replacement viable.
LTV/CAC Ratio
Unlike traditional internet products, calculating user Lifetime Value (LTV) for AI products must subtract computing costs. This also explains why some AI products deliberately restrain user growth—more users don't necessarily mean more profit.
Model ROI
The numerator is all quantifiable benefits from AI (revenue growth, labor cost reduction, efficiency gains); the denominator is total investment (model training, API calls, infrastructure, data labeling, etc.). ROI below 100% means you lose money on every transaction—the business model is unsustainable.

Level 5: Data Feedback Loop Layer—The Engine of Continuous Evolution
This level determines a product's long-term viability, with iteration speed at its core.
Feedback Integration Rate
The proportion of user complaints and feedback that can be corrected. Products must establish a complete loop: feedback collection → data cleaning → root cause analysis → fix deployment.
Bug Attribution Capability
AI system pipelines are relatively long. When errors occur, you must precisely locate where the problem lies: Is the prompt poorly written? Did RAG retrieval go wrong? Or is the model itself lacking capability? Accurate attribution enables effective improvement.
Evaluation Set Coverage
Evaluation sets must cover edge cases and rare scenarios; otherwise, you'll face the embarrassing situation of "metrics look great during testing, but everything falls apart once deployed."
Model Drift Monitoring
An easily overlooked issue: The product hasn't changed at all, but performance keeps declining. Possible causes include:
- Objective knowledge has been updated, but RAG knowledge base data hasn't been synchronized
- The provider silently updated the model version, or even downgraded model intelligence to cut costs
You must establish continuous monitoring mechanisms to investigate root causes promptly when metrics show gradual decline.
Confidence Calibration
LLMs universally suffer from overconfidence—as long as they know a little, they won't be humble; "bragging" comes from the heart. You must use prompt engineering and calibration strategies to give the model an accurate assessment of its own capabilities—when uncertain, explicitly inform users rather than fabricating answers.
Summary: Iteration Speed Is the True Moat of the AI Era
This 5-level, 30-metric evaluation system fundamentally answers three questions:
- Is AI smart enough? (Model Quality Layer + User Experience Layer)
- Is AI cheap enough? (System Efficiency Layer)
- Can AI be profitable and continuously evolve? (Business Value Layer + Data Feedback Loop Layer)
In the AI era, the true moat may not be technological barriers or product barriers, but iteration speed. If your team takes three months per cycle, your competitors' new version might already be live by then. All technologies have an expiration date, and in AI, that expiration date is even shorter.
I recommend that every AI team select the 10-15 most critical metrics from these 30 based on their current business stage as their core dashboard, review them regularly, and use data to drive every iteration decision.
Related articles
 Tutorials
ChatGPT Plus Subscription Guide: Are GPT-5.5, image-2, and Codex Worth the Upgrade?
A detailed look at ChatGPT Plus features — GPT-5.5, image-2, and Codex — with a Plus vs Pro comparison and a complete step-by-step subscription guide for users outside the US.
 Tutorials
Harness AI Engineering in Practice: Using Claude Code to Master Enterprise-Level E-Commerce Development
Deep dive into Harness AI Engineering: master enterprise e-commerce development with Claude Code using the Rules, Skills, Wiki, and Changes framework.
 Tutorials
Cursor + Codex Dual-IDE Collaboration: A Practical Methodology for Open-Source Project Customization
A complete methodology for open-source project customization based on real-world experience, detailing the Cursor+Codex dual-IDE workflow, seven-stage process, MVP validation, and AI source code reading techniques.