Algorithmic Audit vs. Greenwashing: How Machine Learning Quantifies the Market Cost of Corporate Carbon Fraud

Algorithmic analysis of EPA and SEC data proves markets actively penalize greenwashing as a leading indicator of management failure.
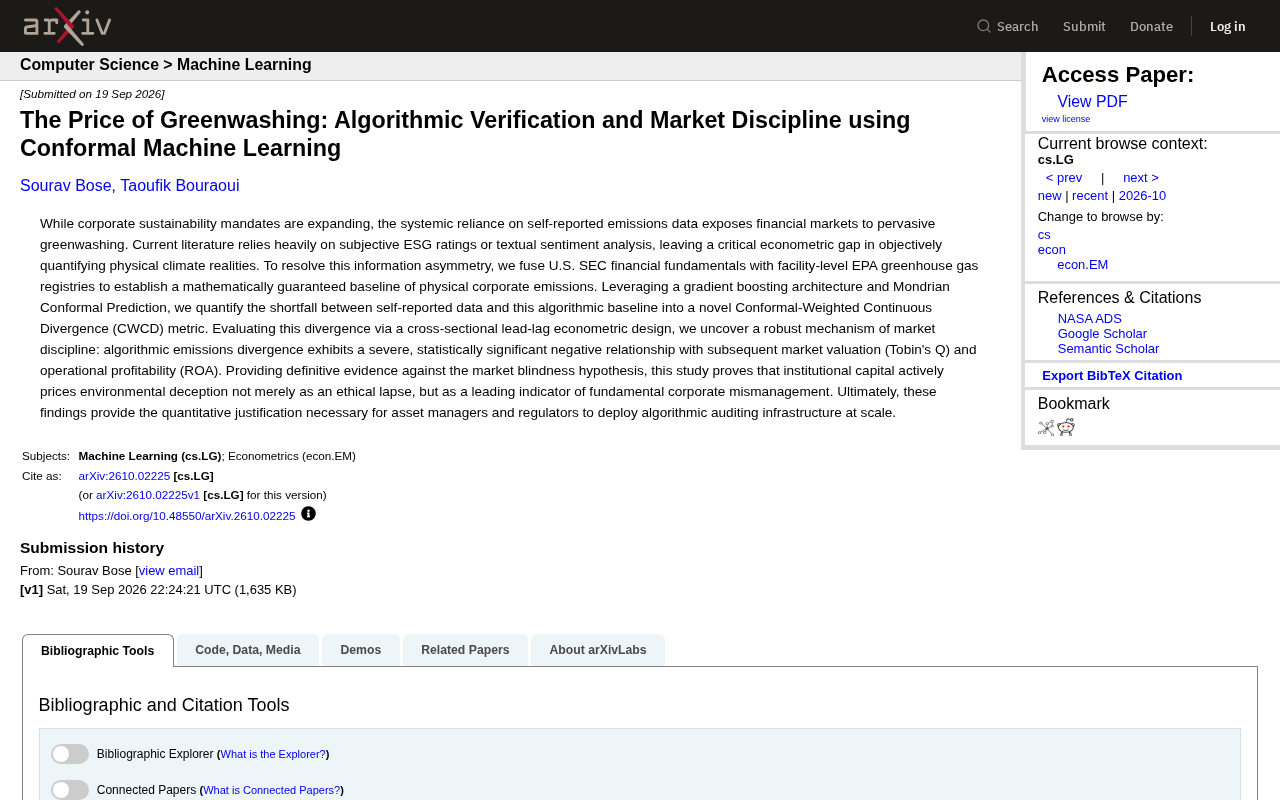
This arXiv preprint proposes a methodology that bypasses corporate self-reporting to objectively quantify carbon emissions fraud. By merging SEC financial data with mandatory EPA facility-level emissions registries, the study uses gradient boosting to construct a physical emissions baseline and Mondrian conformal prediction to generate statistically guaranteed intervals, yielding the novel CWCD metric. Cross-sectional lead-lag analysis shows algorithmic emissions divergence is significantly negatively correlated with firms' subsequent Tobin's Q and ROA, directly refuting the market blindness hypothesis. The deeper implication: markets read greenwashing as an early signal of governance and operational dysfunction, not merely an ethical lapse — providing quantitative grounds for deploying algorithmic audit infrastructure at scale.
When Companies Get to Grade Their Own Emissions
The push for corporate sustainability keeps expanding, yet a structural flaw persists: the vast majority of emissions data comes from self-reporting. This "trust us" mechanism has embedded a pervasive greenwashing risk in financial markets — companies can dress up their environmental performance in disclosures, while the market lacks any objective means to verify whether the numbers are real.
A recent study published on arXiv (arXiv:2610.02225v1) confronts this problem head-on. The authors argue that the academic literature's heavy reliance on subjective ESG ratings or textual sentiment analysis still amounts to reading what companies say, not measuring what they actually emit. This leaves a critical econometric gap: how do you objectively quantify a firm's physical emissions reality?
Cross-Referencing Two Authoritative Datasets to Build a "True Baseline"
The study's core insight is to bypass corporate self-description entirely and construct a mathematically guaranteed emissions baseline directly from hard data. The approach merges two official U.S. data sources: financial fundamentals from the SEC (U.S. Securities and Exchange Commission) and facility-level greenhouse gas registry data from the EPA (U.S. Environmental Protection Agency).
The former captures a company's operational scale and financial condition; the latter records actual emissions factory by factory, facility by facility. Combining them establishes an emissions reference point grounded in physical reality rather than corporate framing. The data sourcing is cleverly designed — EPA facility-level reporting is mandatory and verifiable, which significantly limits opportunities for corporate manipulation.
The Technical Stack: Gradient Boosting + Mondrian Conformal Prediction
On the modeling side, the study uses a gradient boosting architecture to fit the emissions baseline, and introduces Mondrian Conformal Prediction to provide statistically guaranteed prediction intervals.
The value of conformal prediction lies in what it produces: not just a point estimate, but a prediction interval that is valid at a specified confidence level. This lets researchers rigorously determine whether a company's self-reported emissions fall significantly outside the algorithmically derived plausible range. On this foundation, the study constructs a new metric — the Conformal-Weighted Continuous Divergence (CWCD) — to quantify the gap between self-reported data and the algorithmic baseline.
Gradient Boosting is an ensemble learning method that iteratively trains multiple decision trees, where each new tree is specifically fit to the residual errors of the previous model, and all trees' predictions are summed into a final output. Compared to a single decision tree, it is far better at capturing nonlinear relationships and feature interactions, and typically excels on structured tabular data (such as financial and emissions data). Common implementations include XGBoost, LightGBM, and CatBoost.
Mondrian Conformal Prediction is a stratified variant of the Conformal Prediction framework. Standard conformal prediction's core idea is to construct prediction intervals with finite-sample validity guarantees — without any parametric distributional assumptions — using nonconformity scores. At a specified confidence level α, the prediction interval covers the true value at least 1−α of the time, a guarantee that is statistically rigorous. The Mondrian variant goes further by calibrating samples separately within categories or strata (such as industry groups), so that coverage guarantees hold independently within each subgroup. This avoids the systematic bias that arises when companies of vastly different scales or industries share a single calibration set. This property is especially important when assessing emissions deviations: emissions patterns differ enormously between energy-intensive industries and asset-light services, and stratified calibration ensures the algorithm delivers fair, statistically guaranteed interval judgments across all company types.
Does the Market Actually "Punish" Environmental Deception?
With the metric established, the study uses a cross-sectional lead-lag econometric design to test a central question: does the algorithmically revealed emissions divergence correlate with a firm's subsequent market performance?
The results are quite clear. The study finds a severe and statistically significant negative relationship between algorithmic emissions divergence and both subsequent market valuation (measured by Tobin's Q) and operating profitability (measured by ROA). In other words, the more a company's self-reported emissions deviate from the algorithmically derived baseline, the worse its subsequent valuation and profitability tend to be.
This finding directly refutes the so-called market blindness hypothesis — the view that markets cannot detect environmental fraud. The evidence suggests that institutional capital is actively pricing in "environmental deception," and not treating it as a mere moral blemish, but rather as a leading indicator of broader management dysfunction.
From Ethical Concern to Management Signal
This conclusion deserves to be unpacked carefully. It implies that when a company falsifies emissions data, this is rarely an isolated environmental issue — it is more often an outward expression of broader slack in corporate governance and operational discipline. The market's acuity lies in reading "greenwashing" as an early warning about management quality. For investors, metrics like CWCD therefore carry practical value that goes beyond ESG compliance — they may serve as quantitative signals for predicting financial deterioration.
Tobin's Q measures the ratio of a firm's market valuation to the replacement cost of its assets, typically calculated as market capitalization divided by the book value of total assets. A Q above 1 means the market's expectations of future earnings exceed the book value of existing assets, reflecting strong growth prospects and competitive advantage; a persistently declining Q signals falling market confidence in the firm's value-creation capacity. ROA (Return on Assets) measures how efficiently a firm generates net profit from its total assets, and is a standard accounting metric for evaluating management's operational effectiveness. Using both indicators together lets the study cross-validate the economic consequences of emissions divergence from two dimensions — market expectations and operational reality — making the conclusions more robust. The lead-lag design further ensures the plausibility of the causal direction: emissions divergence precedes valuation and profitability changes in time, ruling out the reverse-causality story that firms only abandon environmental practices after they're already in trouble.
Implications for Asset Managers and Regulators
The study lands in a very practical place: its findings provide quantitative grounds for asset managers and regulators to deploy algorithmic audit infrastructure at scale.
One of the longest-standing criticisms of ESG assessment is that it is subjective, inconsistent across providers, and easily manipulated by corporate communications. This research offers an alternative path: using authoritative physical data and statistically guaranteed machine learning methods to build an objective audit system that is scalable and reproducible. For regulators, this means more targeted identification of high-risk firms; for asset managers, it adds a hard metric that can be incorporated directly into investment decisions.
Of course, as a preprint, its conclusions still await peer review and validation on broader datasets, and the methodology currently relies on U.S. SEC and EPA data, so its portability to other markets remains to be tested. But the direction it represents — shifting from "trust corporate self-reporting" to "algorithmically verify reality" — is likely to be a significant step in the evolution of environmental financial regulation.
Summary
The significance of this research lies not only in proposing a new metric, but in using rigorous econometric evidence to demonstrate that markets are far from indifferent to greenwashing. When algorithms can reveal the authenticity of emissions data in a quantifiable, statistically guaranteed way, the cost of environmental deception is no longer a vague reputational hit — it is market discipline showing up directly in valuations and earnings.
Related articles

CoTL: Compact Token Learning Reshapes 3D Scene Representation
CoTL uses compact token sets to learn 3D scene representations, recovering renderable 3D Gaussians via a query-based decoder for novel view synthesis and 3D scene generation.

Thinker-WM: A Unified World Model with Shared Multimodal Representations
Thinker-WM proposes a shared Unified Dynamics Transformer to unify RGB, metric depth, and robot actions, ranking first on EWMBench, WorldOlympiad, and WorldArena, with motion probes and ablations validating the shared representation.
S³-PnP: Self-Supervised Score Priors for Plug-and-Play Denoising in Scientific Imaging
S³-PnP introduces a self-supervised plug-and-play image restoration framework that learns score priors directly from ADMM observation intermediate states, requiring no clean training labels or external pretrained weights, and achieving consistent gains in hyperspectral imaging and MRI denoising.