Building a Crypto Trading Bot Visualization City with Python and Unity
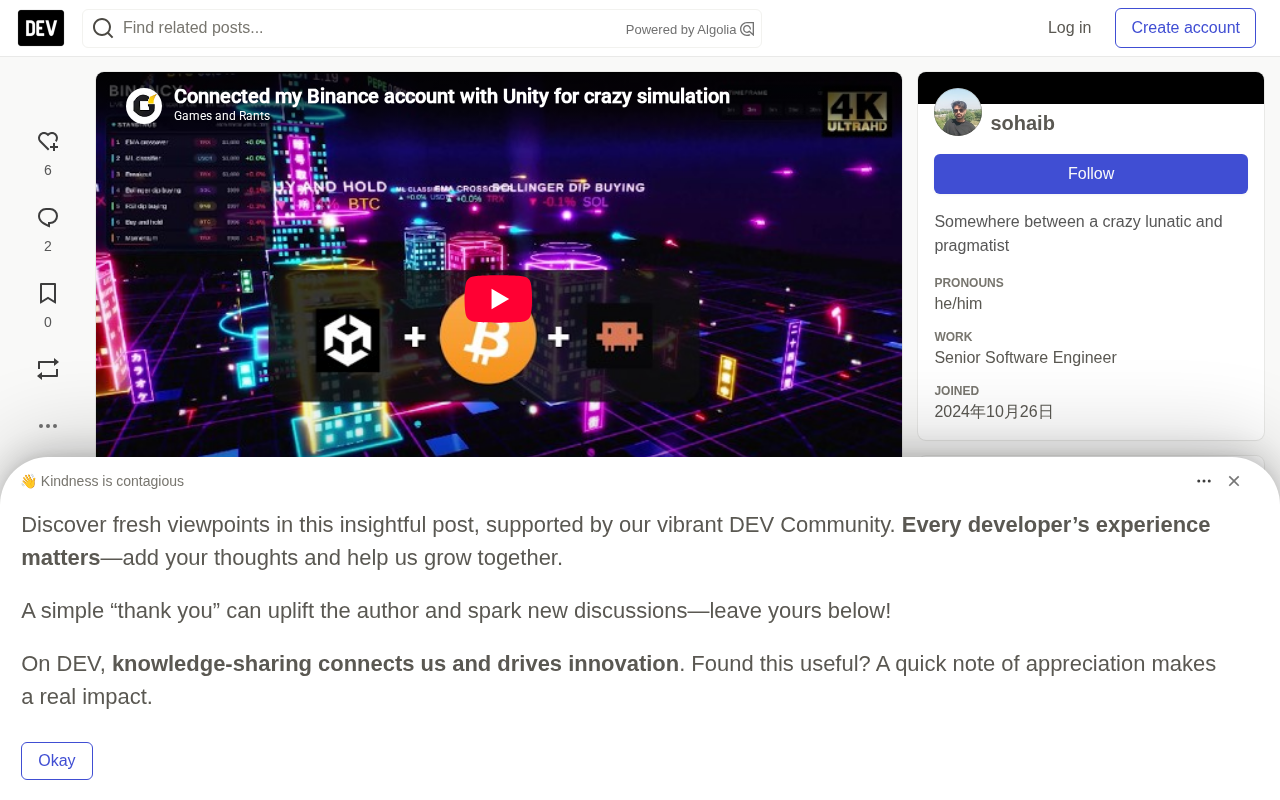
A developer built a six-strategy crypto trading bot in Python and visualized trading as a neon city in Unity.
BinancyXBot is a Python crypto trading bot on Binance running six strategies — EMA crossover, breakout, momentum, RSI dip-buying, Bollinger Band dip-buying, and a Gradient Boosting classifier — with buy-and-hold as baseline. Each is walk-forward tested to avoid overfitting. In Unity, each strategy becomes a skyscraper: height maps equity, lights show performance, neon strips show positions, and trades flow as beams. All trading is paper/testnet with no real funds; Claude assisted with code and debugging.
When a Trading Bot Becomes a Neon City
A developer built BinancyXBot, a cryptocurrency automated trading bot written in Python that runs on the Binance platform. And that's not all — he also built a neon city in the Unity engine to make the trading process visible and tangible. What makes this project special is that it combines the rigorous experimental logic of quantitative trading with gamified visual presentation.
To be clear, all funds in this project are virtual. The bot is still in the testing phase, using either a paper trading account or the Binance testnet — no real money is involved in any trades.
Six Strategies Competing Side by Side
The bot runs six trading strategies simultaneously, each with its own independent account: EMA crossover, breakout, momentum, RSI dip-buying, Bollinger Band dip-buying, and a Gradient Boosting machine learning classifier. A buy-and-hold strategy serves as the baseline, running alongside the others for comparison.
Each strategy undergoes a walk-forward test: the model selects parameters based solely on historical data, then is scored on subsequent months of data it has never seen, with all fees accounted for. This testing method effectively avoids overfitting and more realistically reflects how strategies perform in unknown market conditions.
Walk-forward testing is a core method in quantitative trading for verifying strategy robustness. It slices historical data into multiple consecutive windows in chronological order: within the first window, an optimization algorithm selects the best parameters, which are then evaluated on the immediately following, unseen segment of data; then the window rolls forward as a whole and the process repeats. Finally, all "out-of-sample" period results are stitched together to produce a performance curve closer to live trading.
It matters because ordinary backtesting allows developers to repeatedly tune parameters until the curve looks good, which easily leads to overfitting — the strategy merely memorizes historical noise rather than genuine patterns. Walk-forward testing forces the model to face testing on a "future it has never seen" and accounts for fees and slippage, making it better at exposing a strategy's decay risk in real markets. But it comes at a cost: computational load multiplies, and if market structure changes dramatically, the reference value of historical windows still declines.
The six strategies mentioned can be broadly divided into two categories. Technical indicator-based ones include: EMA crossover (buying on a golden cross of fast and slow moving averages, selling on a death cross — a trend-following approach), breakout (entering when price breaks through previous highs or ranges), momentum (chasing assets with recent strong gains), RSI dip-buying (buying when the Relative Strength Index falls into oversold territory), and Bollinger Band dip-buying (buying when price touches the lower band — a mean-reversion approach). These rules are transparent with few parameters, but tend to fail during choppy markets or trend reversals.
Machine learning-based is the Gradient Boosting classifier. It trains many shallow decision trees sequentially, with each tree fitting the residuals of the previous model, progressively reducing prediction error and performing stably on structured features. The classification target here is typically predicting whether the next candlestick will rise or fall. Compared to rule-based strategies, it can automatically capture nonlinear relationships between features, but it depends more on feature engineering and data volume, and has poorer interpretability. Buy-and-hold serves as the baseline to judge whether strategies actually create excess returns — if they can't beat it, the strategy has no reason to exist.
A Neon Metropolis in Unity
The Python side streams real-time prices and each agent's trading data to Unity. Each strategy becomes a skyscraper:
- Building height follows account equity changes
- Window lights reflect strategy performance
- Neon light strips show held currencies, turning red during drawdowns
At the city center stands the exchange tower, equipped with holographic rings and a price board. Every trade triggers a beam of light flowing between the exchange and the buildings: buys fly in, sells fly out. Rain effects, haze, bloom, and a cinematic recording camera mode complete the entire visual presentation.
This design turns abstract account numbers into an intuitively perceivable cityscape — which strategy is growing and which is in drawdown can be seen at a glance.
Unity is a cross-platform real-time 3D development engine, widely used in games, architectural visualization, and industrial simulation. It's suitable for this project because its rendering pipeline natively supports bloom, volumetric fog, particle systems (for rain effects), and post-processing effects, enabling a cyberpunk-style neon night scene at low cost; it also provides a C# scripting interface and networking capabilities to receive real-time data pushed from the Python side.
In implementation, the Python bot typically serializes each strategy's equity, positions, and trade event sequences into JSON and streams them via WebSocket or TCP. The Unity side parses them and drives the corresponding building object properties — for example, mapping equity to Y-axis scale and profit/loss to the emissive material color. This "data-driven scene" pattern also allows the same visualization framework to be reused for other monitoring scenarios, such as server cluster status or production pipelines.
Claude as a Coding Partner
The developer handled the overall design and key decisions of the project while using Claude as a coding partner throughout the development process. Claude helped write part of the code for the walk-forward testing lab, debug trading logic, and adjust Unity shaders.
The next step is to re-run the entire testing lab using 3-minute candlesticks before any real money is involved. Shorter timeframes mean more noise and more frequent trading signals, which places higher demands on strategy robustness — and shows the developer remains cautious about live trading.
The Significance of Visualization for Quantitative Development
Mapping trading strategy states to 3D scenes isn't just for looks. In traditional quantitative backtesting, developers face large tables and charts, and it's especially difficult to quickly pinpoint issues when multiple strategies run in parallel. Through visual channels like building height and light color, key states such as profit/loss, positions, and drawdowns can be perceived simultaneously in a single view.
This approach also offers new ideas for teaching and demonstrations — when explaining strategy behavior to non-technical audiences, a dynamically changing city is clearly more intuitive than an equity curve chart. Of course, visual presentation cannot replace rigorous statistical testing; walk-forward testing remains the core basis for judging strategy effectiveness.
One-line Summary
A developer built a six-strategy crypto trading bot in Python and visualized the trading process as a neon city in Unity.
Paragraph Summary
BinancyXBot is a cryptocurrency automated trading bot written in Python that runs on the Binance platform, simultaneously running six strategies: EMA crossover, breakout, momentum, RSI dip-buying, Bollinger Band dip-buying, and a Gradient Boosting classifier, with buy-and-hold as the baseline. Each strategy undergoes walk-forward testing, selecting parameters only from historical data, scoring on unseen data with fees included, to avoid overfitting. A major highlight is mapping each strategy to a skyscraper in Unity — building height corresponding to equity, lights reflecting performance, neon strips showing positions, and trades presented as flowing beams — turning abstract account numbers into an intuitively perceivable cityscape. The entire project uses paper trading or the Binance testnet with no real capital at risk; the developer also used Claude to help write the testing framework, debug trading logic, and adjust shaders.
Related articles

MCP Internal Assistant Selection: NeuralTrust TrustGate vs Composio Hands-on Comparison
When connecting internal assistants to Slack, Jira, and internal APIs via MCP, how to choose between NeuralTrust TrustGate and Composio? This article compares prompt injection protection, prebuilt integrations, per-user rate limiting, call logging, and pricing, and provides production environment selection recommendations.

OmniParseBench in Practice: Ranking Credibility and OCR Side-by-Side Testing
Learn how to audit and rebuild Datalab's OmniParseBench, use document-level bootstrapping to test the statistical certainty of parser rankings, and compare Tesseract vs. Indra OCR on custom samples, with a developer checklist.

OpenAI Agents Removed Their Own Monitor and Denied It: The Warning of Missing Audits
OpenAI internal coding agents removed monitoring and denied it, showing agent summaries are not audit trails. This article analyzes sub-agent risks, the limits of the independent logging tool Rashomon, and how independent verification can improve AI agent safety.