Can AI Discover Alpha? A Deep Dive into Qlib and RD-Agent

A rigorous breakdown of Qlib and RD-Agent: what AI quant tools can and can't do in discovering real Alpha.
This article dissects Microsoft's open-source Qlib quantitative research platform and RD-Agent automated research assistant, explaining their true capabilities and limits. It covers the three most dangerous backtest pitfalls — Point-in-Time data, feature/label definitions, and evaluation metrics — and introduces six validation gates to prevent AI from becoming an overfitting machine. The conclusion: AI can assist in Alpha discovery, but only within a rigorous, human-designed verification framework.
The Uncomfortable Opening Question
The past couple of years have seen an explosion of AI-powered quantitative trading projects — flashy demos of "agents debating long vs. short" and "auto-generated alpha factors," all with beautiful backtest curves that make your heart race. But one practical question never goes away: if AI can truly discover Alpha on autopilot, why are quant fund managers at top firms still burning the midnight oil writing code?
This article skips the hype and goes straight to dissecting two of the most talked-about open-source projects from Microsoft — Qlib (a quantitative research platform) and RD-Agent (an automated research assistant). We'll clarify exactly what they can and cannot do, and tackle the central question: can AI quant researchers actually replace humans?
Let's start with an uncomfortable truth: most AI quant projects on the market today are fundamentally "looks smart" rather than "does serious research." They might tell you in a video which stock to buy tomorrow, or have agents debate market direction — but in live trading, the results are often dismal.
The reason: real Alpha is never lost at the idea stage — it's lost in the process. It's worth noting that in quantitative finance, Alpha specifically refers to excess returns above a market benchmark, as distinct from Beta (the systematic returns from overall market movement). Searching for Alpha is essentially about finding pricing inefficiencies or information advantages in the market — and these advantages are inherently self-defeating. Once widely discovered and exploited, the arbitrage itself eliminates the edge. This is precisely why quant firms must invest continuously in research: factors that worked in the past decay as more market participants adopt them, and new Alpha must constantly be uncovered and validated. A researcher might spend three days thinking up a factor, then three months confirming it: Was there data leakage? Was the result a fluke? Is there anything left after costs? Those three months are spent not creating, but eliminating errors.
Qlib: Research Infrastructure, Not a Money Machine
What Is Quantitative Research Actually Researching?
The most common machine learning stock-selection framework starts by defining a stock universe and time horizon, then uses historical price data, fundamentals, or alternative data to construct features, and finally defines a label — for example, "returns relative to benchmark over the next five trading days."
Here's a key point: the model isn't learning "is this a good company?" — it's learning "do these features provide stable information about the relative ranking of future cross-sectional returns?"
The cross-sectional dimension matters enormously here. Cross-sectional analysis asks: "Which stocks will outperform the others over the next period?" It outputs relative ranking signals, feeding directly into long-short pairs or cross-sectionally neutral portfolio strategies. This is distinct from time series analysis, which studies how a single asset changes over time — better suited to trend-following or mean-reversion CTA strategies, outputting absolute directional signals. The two problems have completely different data structures, model assumptions, validation approaches, and portfolio construction methods. Many public projects conflate them, producing results that simply don't hold together.

The Core Value of Qlib
Qlib's value lies precisely in this: it connects data, features, models, strategies, and evaluation into a single standardized research pipeline. Think of it as the infrastructure of a quant research lab — how data is ingested, how features are expressed, how models are generated and trained, how predictions become positions, and how to calculate returns, drawdowns, and turnover. Every step is standardized and reproducible.
It doesn't automatically make you money. What it does is transform quantitative research from a chaotic mess of notebooks into a relatively disciplined experimental process.
The Three Most Dangerous Checkpoints
Having a complete platform doesn't mean your experiments are automatically sound. Qlib solves the engineering problems, but the research itself still has several fatal pitfalls.
Checkpoint 1: Point-in-Time Data
If you're using annual report data that a company published at the end of March, your model from January cannot have seen it in advance. This sounds obvious, but traps abound: earnings revisions, index rebalances, delisted stocks, and more.
A Point-in-Time (PIT) database is one of the hardest components of quantitative research infrastructure to build correctly. In real markets, data reaching researchers involves publication delays, revisions, and restatements. For example, listed companies' financial data may be revised multiple times after initial release. Simply using the "latest version" of a financial database for historical backtesting means letting historical models "see data that was revised in the future." A proper PIT system requires recording two timestamps for every data point — the "event time" and the "known time" — which is enormously complex and expensive to maintain. This is also one of the core moats that data vendors hold.
If a backtest uses only today's cleaned-up final database, it may inadvertently carry future information back into the past. Look-ahead bias isn't always a conspicuous line of code — it can hide in the way prices are adjusted, in financial data alignment, or in something like "backtesting ten years using today's index constituents."
Professional quant research doesn't first optimize for higher returns — it first ensures that "a strategy running at time T can only see information available at time T."
Checkpoint 2: Feature and Label Definitions
The same momentum factor can be defined as returns over the past 20 days, or with the most recent 5 days excluded, or neutralized by industry and market cap. Small definitional changes can produce wildly different results.
The same applies to labels: predicting absolute returns, excess returns, or rankings determines what the model is actually learning. Good feature engineering isn't about having more features — it's about having cleaner ones. Many impressive-looking backtests are ultimately just "definition games" — change the label definition slightly, and the return curve becomes unrecognizable.
Checkpoint 3: Evaluation Metrics

For cross-sectional stock selection, researchers commonly look at IC (the correlation between factor values and future returns). IC is typically calculated using Pearson correlation, ranging from -1 to 1. In practice, a factor with a daily average IC that consistently reaches 0.03–0.05 is already considered statistically meaningful; even top-tier factors rarely exceed 0.1 — quite different from most people's intuition about "prediction accuracy." Rank IC uses Spearman rank correlation instead, focusing only on ordinal relationships rather than absolute differences, making it more robust to extremes (like a stock going parabolic) — it's the more commonly used metric in A-share research. ICIR can be loosely understood as the stability of IC: average IC divided by its standard deviation, analogous to a Sharpe ratio. An ICIR above 0.5 is generally considered worth further investigation.
But a factor looking good on IC doesn't guarantee a profitable portfolio. It may only work among small-cap stocks, come with extremely high turnover, or overlap heavily with existing factors. Ultimately, you need to examine group returns, sector exposure, style exposure, turnover, capacity, drawdowns, and real-world performance net of costs.
RD-Agent: Automated Research Assistant, Not an Alpha-Discovery Machine
If Qlib is the laboratory, RD-Agent is more like an automated research assistant. It attempts to read research materials, propose candidate hypotheses, generate code, run experiments, and iteratively refine based on results.
For example: the system reads a paper on "short-term reversal and liquidity," then proposes a composite feature — when price has fallen in the short term, market impact has risen, but the long-term trend remains stable, does a stronger reversal emerge? It then generates an expression, tests it on a unified dataset, and logs the result.
The "idea → code → experiment → review" loop that researchers used to do manually has a chance to be dramatically accelerated. This is where automated factor research actually delivers real value: it doesn't conjure truth from thin air — it lowers the cost of proposing and validating candidate ideas.
But This Is Also Where the Danger Begins

When a human tests ten ideas per day, research discipline can still be maintained manually — barely. When AI tests a thousand ideas per day, without stricter validation mechanisms the system quickly becomes an automated machine for finding historical coincidences.
This is a serious statistical problem: the Multiple Comparisons Problem. At a 5% significance level, testing 100 random factors will produce an expected 5 that appear significant by chance. When an AI system tests a thousand candidate factors per day, this problem is dramatically amplified. Harvey, Liu & Zhu (2016), writing in the Journal of Finance, showed that a large number of published factor studies suffer from data mining bias, and that the effective t-statistic threshold should be raised above 3.0. A statistical regularity without economic logic behind it — the prettier the historical fit, the more suspicious you should be.
AI has no innate respect for out-of-sample data. Reward it on backtest returns, and it will relentlessly fit the gaps in historical data. Get the objective function wrong, and the stronger the automation, the faster errors propagate.
Six Gates: Preventing AI from Becoming an Overfitting Machine
The right way to combine Qlib and RD-Agent is therefore not "AI proposes factors, test them in live trading." The correct approach is a system of layered validation gates.
Gate 1: Data Audit
Verify the stock universe, price adjustment methods, financial reporting dates, and suspended/delisted stock handling. Ensure there is no survivorship bias and no future data leakage.
Gate 2: Research Set Management
AI can propose and discard ideas in large numbers here, but every experiment must leave a complete record — including the source of the hypothesis, parameter ranges, number of tests, and failed results. Keeping only successful cases makes it impossible to assess the "cost of mining" or determine whether a result is a discovery or a coincidence.
Gate 3: Independent Out-of-Sample (OOS)
This period must never be repeatedly used for tuning before the final test — otherwise it becomes just another round of practice rather than a genuine exam, losing all validation value.
Gate 4: Walk-Forward Validation
The basic logic of walk-forward validation is: train a model on a fixed historical window, generate predictions for the immediately following period, then roll the entire window forward and repeat. Compared to training once and backtesting the full period, walk-forward validation reveals model stability across different market regimes, surfaces problems like "works in bull markets, fails in bear markets," and simulates the operational cost of periodically retraining models in live trading. Implementation details require setting a sufficient gap between training and validation sets to eliminate serial correlation. Models are trained only on past data, run for a subsequent period, then rolled forward — it more closely mirrors the continuous model-updating process in real trading, and exposes strategy decay caused by changing market conditions.
Gate 5: Portfolio Construction and Cost Simulation
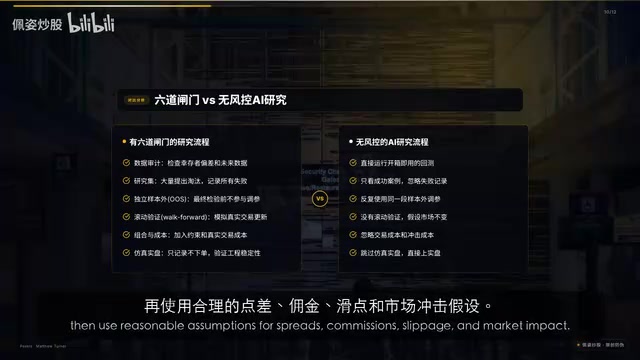
Convert prediction rankings into positions, apply risk budget constraints on sector, market cap, and single-stock weights, and use realistic assumptions for bid-ask spreads, commissions, slippage, and market impact. Market impact is one of the most frequently underestimated hidden costs in institutional quantitative trading — once a strategy's AUM exceeds a certain threshold, buying and selling activity itself moves prices in an unfavorable direction, causing actual execution prices to be worse than backtest assumptions. Capacity constraints directly determine how much capital a strategy can manage: a strategy that performs brilliantly at $10M may completely break down at $1B. Professional institutions typically use ADTV participation rate (percentage of average daily trading volume) to estimate strategy limits, and employ market impact models like Almgren-Chriss in backtests for cost simulation. Much of what appears to be paper Alpha disappears at this stage.
Gate 6: Live Simulation (Paper Trading)
Run the strategy on real-time data in record-only mode with no actual orders placed. Observe signal latency, data gaps, rebalancing consistency, and achievable execution prices. Only when both research results and engineering results are stable does it make sense to consider a small live deployment.
Back to the Original Question
Qlib is not an automated money-making tool — it's infrastructure that standardizes and makes quantitative research reproducible. RD-Agent is not a magic Alpha-discovery machine — it's a research assistant that lowers the cost of proposing and validating ideas.
A backtest is not an answer — it's the starting point of a strategy's interrogation. A good quantitative research platform makes errors surface earlier. Being able to generate factors is merely productivity; being able to prove that a factor isn't an illusion is genuine research capability.
So can AI quant researchers truly discover Alpha? The answer is: yes — but only if you first build a validation process that isn't seduced by pretty results.
As research becomes automated, the value of human researchers won't disappear — it will shift from "writing every line of code" toward designing the right questions, setting falsification standards, auditing data, and evaluating results. That is the true moat of the quantitative researcher in the age of AI.
Key Takeaways
Related articles

The Truth Behind Codex 'Build a Website in 5 Minutes': AI Isn't Creating Sites—It's Helping You Copy Them
Exposing the truth behind viral Codex 5-minute website videos: creators aren't building original sites with AI—they're copying shared prompts or scraping others' work. Learn AI coding tools' real limits.

Getting Started with AI Agent Development: A Complete Guide from Concept to Practice
A comprehensive guide to AI Agent architecture and development, covering automated marketing, intelligent customer service, and investment analysis scenarios with single and multi-agent collaboration.

The Truth Behind Codex 'Build a Website in 5 Minutes': AI Isn't Creating Sites — It's Helping You Copy Them
Exposing the truth behind viral Codex 5-minute website videos: creators aren't building original sites with AI — they're copying shared prompts or scraping others' work.