Chrome DevTools for Agents: Building a Closed-Loop Feedback Cycle for Coding Agents

Chrome DevTools for Agents gives coding agents the same runtime debugging feedback loop human developers rely on.
Chrome DevTools for Agents is a new tool from the Chrome team that gives coding agents the same "inspect–debug–fix" closed-loop feedback human developers have relied on for decades. Built on Puppeteer and Chrome for Testing, it ships as an NPM package with both MCP server and CLI interfaces, plus six built-in skills. Use cases include automated UI bug fixes, cross-viewport testing, and performance/accessibility audits. Partner company PAIR built 14 specialized skills to achieve a 10x delivery speed improvement. An AutoConnect feature lets agents tap into a live Chrome session, though connecting to a personal profile carries data and security risks.
At a Google I/O Connect session, Matthias from the Chrome team delivered a deep dive into Chrome DevTools for Agents. The core premise is straightforward: over the past two decades, human developers have relied on DevTools to establish an "inspect–debug–fix" feedback loop — yet coding agents have barely touched this toolchain. The Chrome team believes that opening up DevTools capabilities to agents gives them access to the same feedback loop that human developers have always depended on.
Why Agents Need DevTools
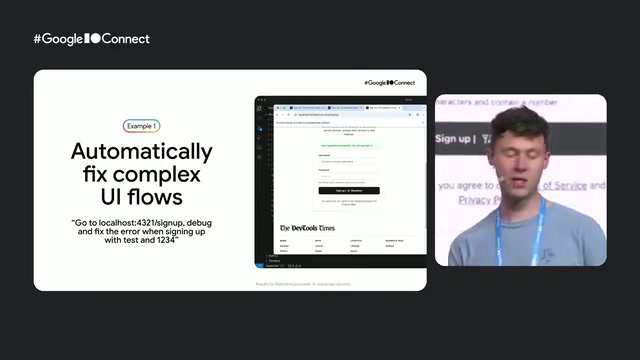
The talk illustrated the problem with a concrete example. Imagine a signup form that uses an internal authentication service called Showtime. When registration fails, it returns a vague error like "app error 1003". This service has no public documentation, and no model's training data would include it.
A typical coding agent hits a dead end here: it relies on you to manually locate the issue. Even if you directly prompt it to "fix app error 1003 in the signup form," it can only search the codebase for that error code — and will most likely start to spiral. Best case, it finds a comment saying "TODO: handle specific error codes," and nothing more.
The real answer isn't in the training data or the source code — it's in runtime data. When the form is submitted, it fires a request to an API, and all network requests are visible in DevTools' Network panel. Inspecting the response preview of that failed request reveals additional information that can be used to give users a clearer message. What DevTools for Agents does is expose exactly this kind of runtime information to the agent.
Change the prompt — instead of pointing the agent at specific files, point it at the runtime. Because DevTools for Agents has access to source maps, it opens a real Chrome instance, attempts to log in, captures console logs and network requests, then combines these clues to perform an end-to-end automated fix. That's the value of a closed feedback loop.
Under the Hood: Built on Puppeteer and Chrome for Testing
While DevTools for Agents is new, it's built on top of mature tools the Chrome team has maintained for years — Chrome for Testing and Puppeteer.
At its core, it's an NPM package that can be installed on any machine running a reasonably modern version of Node.js. Your agent — whether it's Antigravity, Claude Code, Codex, or something else — can interact with it in two ways: via an MCP server or a CLI, both of which ship with the same NPM package. The CLI lets agents script DevTools operations and is more token-efficient than the MCP server.
The third key ingredient tying everything together is a set of skills that teach agents when and how to use DevTools for Agents. Six skills are built in, falling into two broad categories: some (like the Chrome DevTools and CLI skills) cover core concepts and general usage, while others (accessibility debugging, memory leak debugging, LCP optimization) encapsulate domain-specific expertise, giving agents expert-level capability in those areas.
The layer that actually communicates with Chrome is Puppeteer. Understanding this layer also helps assess the security boundary. The talk specifically addressed a common concern: DevTools for Agents cannot access passwords saved in Chrome's password manager — because it doesn't use Chrome the way a human user does. It only invokes verified Puppeteer skills, and Puppeteer doesn't expose the password manager. Additionally, it defaults to a separate incognito browser profile that has no saved passwords to begin with.
Puppeteer is a Node.js library maintained by the Chrome team that controls Chrome or Chromium programmatically via the Chrome DevTools Protocol (CDP). It's commonly used for automated testing, web scraping, and screenshot generation. Chrome for Testing is a separate Chrome build released by the Chrome team specifically for automation scenarios, maintained independently from the version users run daily, with fixed versioning and predictable behavior to prevent auto-updates from breaking test pipelines. Source maps are files that map minified, bundled, or transpiled production code back to the original source, allowing DevTools for Agents to pinpoint actual source file line numbers at runtime rather than facing a wall of obfuscated variable names. MCP (Model Context Protocol) is an open protocol introduced by Anthropic that allows AI models to invoke external tools and data sources in a standardized way. Exposing capabilities as an MCP server means any compatible agent can connect directly without requiring per-agent custom integration.
Three Typical Use Cases
Agents don't call Puppeteer APIs directly. The Chrome team has wrapped key capabilities into a set of clearly described, agent-friendly tools organized into six categories. The talk demonstrated three use cases that combine tools across categories.
The first is the form debugging and self-verification scenario described above, combining input automation with network and navigation tools — the agent navigates to a page, fills out a form, fixes the underlying error, and verifies its own fix.
The second is one-off bug verification, combining simulation tools (changing viewport size) with debugging tools (screenshots). For example, when a report comes in saying "not all navigation items are visible on every screen," you can prompt the agent to check whether all nav items are visible across desktop, tablet, and mobile viewports. The agent opens Chrome, switches viewports one by one, takes screenshots, interacts with the hamburger menu on mobile, and returns a complete answer — fully automating the testing process across three viewports and nested menus.
The third use case is extending your area of expertise. If you're not well-versed in performance, accessibility, or SEO, a vague prompt like "improve the performance of this project" will typically cause an agent to slowly read through project files, burn tokens, and randomly fix things that may not actually affect performance. With DevTools for Agents' dedicated performance trace, accessibility, best practices, and SEO audit tools, it can actually measure known issues rather than guessing from source code — for example, "run a performance trace and act on all findings," starting from what actually matters.
The talk also mentioned Modern Web Guidance as a complement to debugging: a set of skills covering Chrome's modern web best practices. In a demo, the same dark/light mode toggle component was built two ways — without the skill, the AI handled state, animation, and positioning with JavaScript; with it, the agent used modern primitives like CSS starting styles, anchor positioning, and light-dark(), resulting in a final artifact of just 2.6KB with zero JavaScript.
PAIR's 10x Efficiency Case Study
One-off prompts are useful, but DevTools for Agents really shines when baked into a workflow by default. PAIR, a partner company based in Hamburg, Germany, is a prime example — they increased delivery speed by 10x, going from weekly releases to multiple deployments per day for client projects.
They built 14 highly specialized skills. For instance, a review code skill instructs the agent to conduct extremely rigorous local code reviews; a Figma validate skill has the agent iteratively align an implementation to its original Figma design; and a GitHub issue test skill teaches the agent how to verify work documented in GitHub issues.
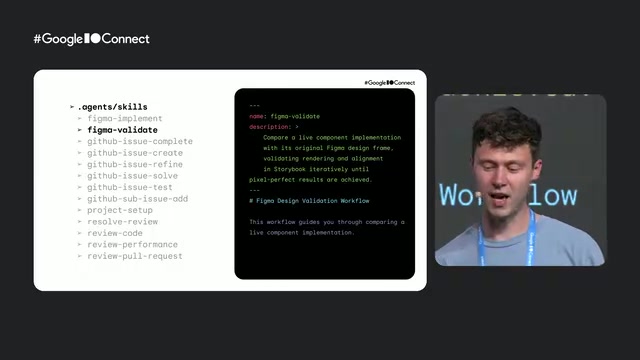
Taking the GitHub issue test skill as an example: after defining the task and role (senior software engineer), it breaks the testing process into four phases — issue analysis and state detection, planning, execution in a real browser, and final reporting. The skill spans over 120 lines, and the third phase alone pre-defines three scenarios — A: Chrome DevTools MCP is available; B: it's not; C: a more token-efficient approach is needed. By explicitly providing fallback paths, the agent can fall back to B or C if Plan A fails, rather than going off the rails.
Three best practices can be distilled from this: precise guidance (clearly state what to do and how, even naming specific tools), simplified execution (pave the way for the agent, such as providing shortcut JS utilities to bypass login screens so it doesn't repeatedly search for or re-implement the same thing), and require verification (instruct the agent not to skip steps and to check its work through repeated snapshots — otherwise it's prone to stopping halfway).
What the PAIR case fundamentally demonstrates is the institutionalization of the feedback loop: rather than ad-hoc prompting the agent to "check if there are any issues in the browser," you codify the review criteria and execution paths into skill files so the agent operates to the same high standard every time. This mirrors the philosophy behind CI/CD pipelines in software engineering — converting human judgment into repeatable automated checks. The 14 specialized skills also reflect a separation of concerns principle: code review, visual alignment, and issue verification are each handled independently, giving the agent clear success criteria at every stage and avoiding the goal ambiguity that comes with generic prompts. It's also worth noting that explicitly pre-defining multiple execution paths (A/B/C fallback) within a skill is essentially structured prompt engineering used to compensate for the fragility of large language models — without explicit fallback instructions, models often fail silently or produce hallucinated outputs when a tool is unavailable.
Configuration and AutoConnect
DevTools for Agents works out of the box, but it also offers configuration options. MCP server users can add options to the args array in the relevant config file (typically .gemini/settings.json for Gemini CLI, or .mcp.json in the project root for Claude); CLI users need to explicitly include options in their prompts. You can specify connecting to a non-stable Chrome channel, or enable experimental features like third-party tool support.

The most notable feature is AutoConnect — think of it as "screen sharing with your agent." It allows the agent to connect to an already-running Chrome instance and pick up directly from wherever you are. Going back to the signup example: if the error is already staring you in the face, why write a prompt asking the agent to reproduce the same state, or manually copy-paste console errors? Enabling it is simple: go to Chrome Inspect, select Remote Debugging in the sidebar, check "Allow remote debugging," and then enable AutoConnect in your configuration or prompt.
However, the talk repeatedly emphasized the same security warning: be deliberate about what access you grant the agent. When using AutoConnect, if you connect to your personal Chrome profile rather than the default incognito one, your personal data is at risk — a prompt like "go to google.com shopping and order 999 balloons" could very well succeed and result in unexpected charges.
Getting Started
The Chrome team provides installation instructions and in-depth documentation for over 20 coding agents at developer.chrome.com, along with a setup tutorial on YouTube (google/DTA-setup). As an open-source project, contributions are welcome on GitHub (google/DTA-repo). Additionally, the AI assistance panel within the DevTools UI has been upgraded to run on Gemini 3 Flash, offering more structured visual output, with a "Copy to coding agent" button to export findings directly at the end of an investigation.
The talk closed with three action items: install and try DevTools for Agents; take inspiration from PAIR and incorporate these capabilities into your own daily workflow; and keep up with the monthly release notes. The core philosophy remains unchanged — giving coding agents the same closed-loop feedback that human developers have benefited from throughout their entire careers.
Related articles

Breaking Chrome in Six Days: A Deep Dive into XBOW's Exploit Chain
AI security firm XBOW claims to have built a full Chrome exploit chain in six days, achieving remote code execution. This article analyzes the background, the difficulty of Chrome exploit chains, AI's role, and the potential impact on the security ecosystem.

Claude Startups Team Benefit Marked as Claimed but Never Delivered
Reddit users report that Claude Startups team benefits were marked as claimed, but the Team plan was never actually created. This article analyzes the impact of the status synchronization bug, user responses, and implications for developer support program workflows.

Gmod TTT: Boba's Winning Streak and Game Design Insights
An in-depth analysis of Gmod TTT's role system, creative items, and social gameplay mechanics, exploring the relationship between randomness design and game balance through Boba's winning streak phenomenon.