Computer Adds Inline Charts with TradingView Financial Visualization Integration

Computer adds inline charts and TradingView integration, pushing AI tools toward multimodal visual output.
Computer platform has added inline charts, diagrams, and data visualization features, letting users generate and view graphical content directly within AI conversations or workflows — no external tools required. The standout addition is integration with TradingView, giving users real-time, context-aware professional financial charts when discussing markets or financial data. The update covers use cases from financial analysis to process documentation and data reporting, marking a clear shift toward multimodal AI output. Specific details such as chart types, interaction methods, and data coverage remain limited and await further clarification.
Feature Overview
The Computer platform has announced the launch of inline charts, diagrams, and data visualization capabilities, enabling users to generate and view graphical content directly within conversations or workflows. The most notable addition is the integration of contextual financial charts from TradingView, meaning users can access real-time, context-aware professional charts when discussing markets, stocks, or financial data.
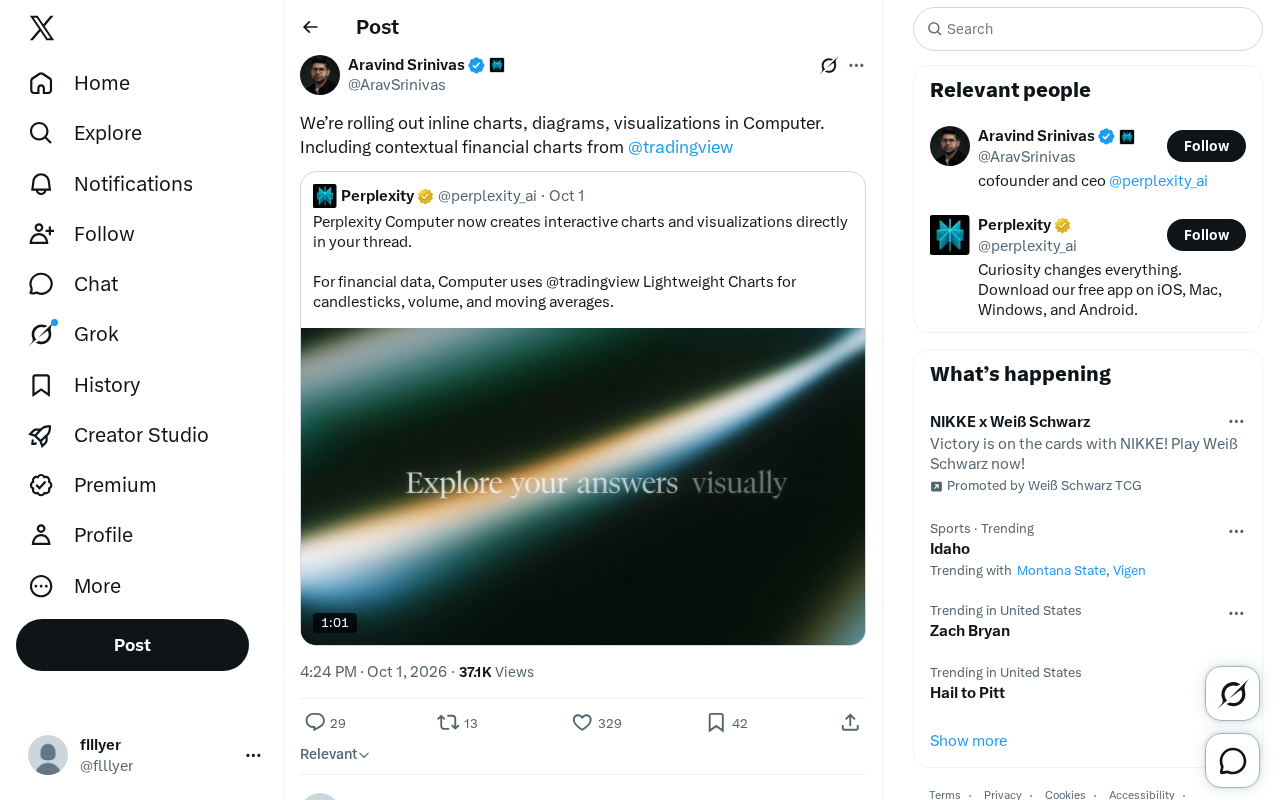
The addition of these capabilities marks a significant shift in AI tools — moving from purely text-based interactions toward richer multimodal output. For users who frequently work with data and visuals, being able to produce visualizations without switching to external tools represents a meaningful improvement in experience.
"Multimodal output" refers to an AI system's ability to generate multiple content formats beyond text — such as images, audio, tables, or interactive charts. Early large language models (LLMs) were largely confined to plain text output. As models like GPT-4V and Gemini introduced visual understanding, and AI products added rich media rendering on the frontend, multimodal capabilities have gradually become an industry-wide direction. Inline charts are a prime example of "output-side multimodality" — as the model generates a text response, it simultaneously triggers a corresponding visualization component and renders it directly within the conversation interface, giving users complete information without ever leaving their current context. This capability is especially valuable for workflow-oriented AI platforms, where frequent tool-switching disrupts cognitive flow and reduces overall efficiency.
Why Inline Visualization Matters
Traditional AI conversation output is predominantly text-based. When it comes to data trends, process structures, or financial movements, plain text often falls short of conveying information intuitively. Inline charts make information presentation far more efficient: trends become immediately apparent, structural relationships are clearly visible, and the barrier to understanding complex data drops significantly.
For financial use cases, the TradingView integration is particularly significant. TradingView is one of the most widely used charting and market data platforms in the industry, offering professional technical analysis capabilities. By embedding these contextual financial charts into AI workflows, users asking about market movements or analyzing assets can simultaneously receive both a written interpretation and visual evidence — creating a complete information loop for decision-making.
Founded in 2011, TradingView is now one of the world's largest charting and social trading platforms, with over 50 million monthly active users. Its core strengths include real-time market data across multiple asset classes — stocks, forex, cryptocurrencies, futures — along with hundreds of built-in technical analysis indicators (such as MACD, Bollinger Bands, and RSI) and a custom scripting language called Pine Script. The platform supports multi-timeframe switching, pattern recognition, and strategy backtesting, making it a go-to tool for professional traders and quantitative researchers. Embedding TradingView into an AI workflow means that when AI answers financial questions, it can draw on this market-proven chart infrastructure rather than generating its own static visuals of uncertain accuracy — a meaningful advantage for users who rely on precise market data to make informed decisions.
Potential Use Cases
The combination of inline charts, diagrams, and visualizations covers a broad range of use cases:
- Financial analysis: View price trends, technical indicators, and more directly via TradingView's contextual financial charts.
- Process and architecture representation: Use diagrams to illustrate system structures, business workflows, or logical relationships.
- Data reporting: Present statistical results in chart form, making it easier to communicate findings with teams.
This integrated output approach reduces the overhead of switching between multiple tools, allowing AI to function as a genuine component of productivity workflows.
Summary
This update was announced via an official tweet from Computer. Details disclosed so far remain limited — the specific range of chart types, interaction methods, and breadth of data coverage have yet to be fully verified. That said, the direction is clear: natively integrating visualization capabilities into AI tools and bringing in professional data sources like TradingView is an important step toward greater practical utility. It's worth watching how these features develop and mature going forward.
Related articles

Why Does the Tesla Roadster Need to Fly? A Deep Dive into Musk's Wild Demo
Tesla's Roadster launch showed wall-climbing, upside-down driving, and flying stunts—but The Vergecast notes the demo car may lack a battery, the Rocket version is invite-only and not street-legal, and the website terms don't guarantee delivery. After nine years of delays, why does this car still need to exist?

AI Is Not a Replacement: Human-AI Collaboration Through the Lens of Factory Root Cause Analysis
Starting from factory root cause analysis, this article explains how AI accelerates evidence chain construction rather than replacing human experts, exploring the pragmatic implementation logic and business value of 'AI supporting people rather than replacing them.'

AI Agent Decision Auditing: Building an Evidence Chain in Regulated Workflows
Starting from a Reddit discussion, this article analyzes three core issues in AI agent decision auditing within regulated workflows: what fields audit records should contain, how to handle feedback latency for erroneous decisions, and how to continuously calibrate LLM judge consistency with human judgment.