Design Formulas for Prediction Research: Ex-Ante Estimation of Out-of-Sample R² for OLS and Ridge Regression

A new paper proposes design formulas for prediction models, using four quantities to ex-ante estimate out-of-sample R² and correlation.
Traditional ex-ante power analysis only answers whether an effect can be detected, not how well a model predicts on new samples. The paper proposes closed-form design formulas for prediction models that estimate expected out-of-sample R² and observed-predicted correlation r before data collection. The formulas depend on four design-stage quantities: sample size N, predictor count p, assumed population R², and design efficiency factor D*. D* captures covariate leverage non-uniformity, making the formula sensitive to data imbalance and skew, surpassing classic shrinkage formulas that rely only on N and p. The paper derives expected OLS and ridge regression performance under LOOCV and validates via simulation. A smartphone-behavior personality prediction case shows ex-ante calculation can determine that OLS cannot beat the sample-mean baseline while ridge regression can, with an accompanying R package predpower implementing all computations.
Article Content
In psychology, the social sciences, and data science, researchers often discover only after collecting their data that a model's predictive power falls far short of expectations. Traditional ex-ante power analysis only addresses the question of "can an effect be detected," but does not answer "how well can the model predict on new samples." A new paper proposes design formulas for prediction models, enabling researchers to estimate the expected out-of-sample $R^2$ and the observed-predicted correlation $r$ before collecting data.
The Blind Spot of Traditional Shrinkage Formulas
Classic shrinkage formulas (such as the Ezekiel formula and Adjusted $R^2$) consider only two factors when estimating out-of-sample performance: the sample size $N$ and the number of predictors $p$. This simplification implicitly assumes that all observations exert a uniform influence on model fit.
Real data almost never satisfy this assumption. When covariates exhibit imbalance or skew, certain observations become high-leverage points that disproportionately influence the regression coefficients. This means that even if two studies have identical $N$ and $p$, their out-of-sample predictive performance may differ dramatically due to different covariate distribution shapes.
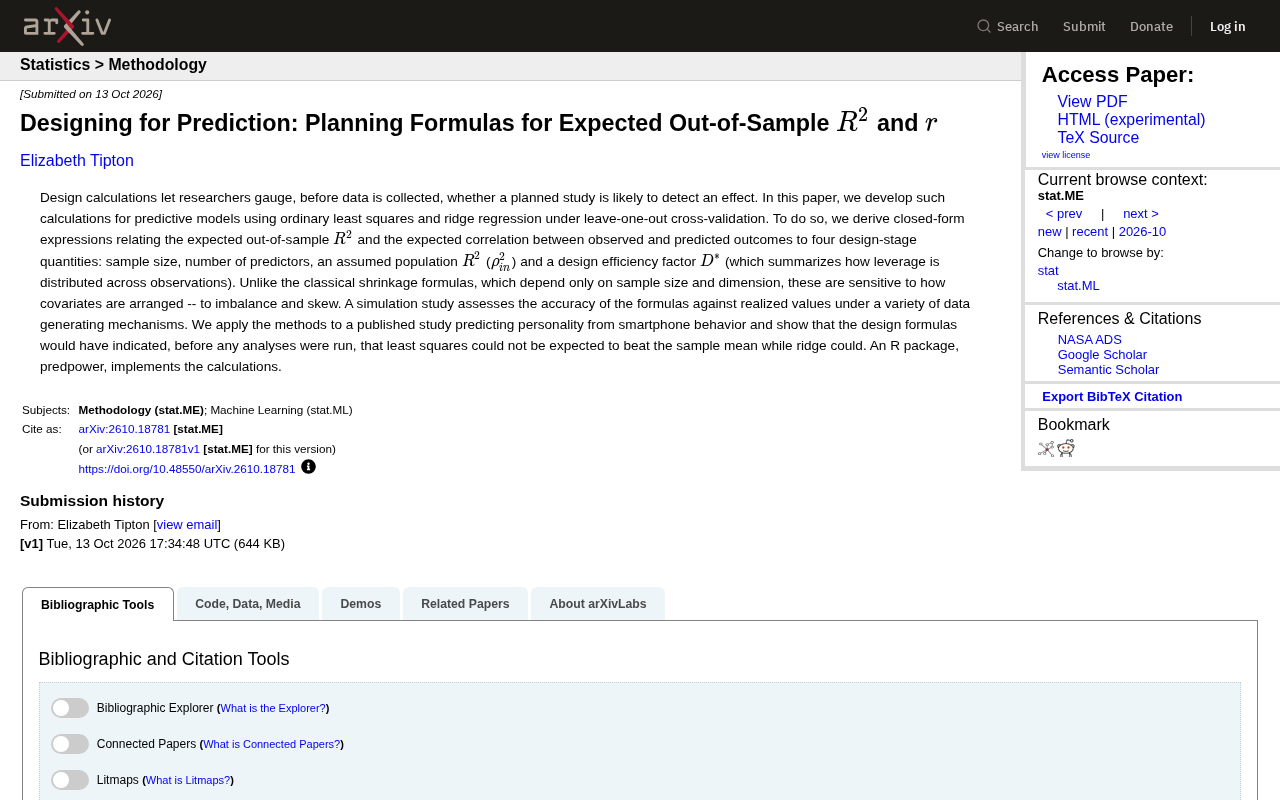
The paper's authors introduce a key design efficiency factor $D^*$ to summarize how leverage is distributed across observations. This enables the new formula to capture structural differences that traditional methods overlook.
Leverage is a core concept in regression diagnostics, referring to the influence of the $i$-th observation on its own fitted value $\hat{y}i$. In OLS, leverage is given by the diagonal elements $h{ii}$ of the hat matrix $H = X(X^\top X)^{-1}X^\top$, satisfying $0 \le h_{ii} \le 1$ and $\sum_i h_{ii} = p+1$ (when an intercept is included). When an observation's covariate values are far from the sample center (e.g., extreme skew or imbalanced distribution), its $h_{ii}$ approaches 1, meaning that point nearly "single-handedly determines" its own predicted value—the model's fit to that point is almost interpolation rather than generalization. High-leverage points significantly inflate the training-set $R^2$ while contributing little to out-of-sample performance, causing traditional shrinkage formulas to overestimate predictive ability. $D^*$ is precisely a global measure of how much the distribution of ${h_{ii}}$ deviates from uniformity, thus capturing this structural effect that classic formulas ignore.
Four Design-Stage Quantities Determine Predictive Performance
The closed-form expressions derived in the paper relate the expected out-of-sample $R^2$ and expected correlation $r$ to four design-stage specifiable quantities:
- Sample size $N$: the number of observations, the core parameter of traditional power analysis
- Number of predictors $p$: the number of features included in the model
- Assumed population $R^2$ ($\rho^2_{in}$): the researcher's prior estimate of the true effect size
- Design efficiency factor $D^*$: a measure of how uniformly leverage is distributed
The introduction of $D^$ is what distinguishes this method from classical formulas. When the data distribution is balanced, $D^$ approaches a baseline value, and the new formula reduces to results similar to traditional formulas; when the data exhibit severe imbalance or skew, $D^*$ deviates significantly from the baseline, leading to substantial adjustments in the estimated predictive performance.
Out-of-sample $R^2$ and the observed-predicted correlation $r$ are two complementary metrics for assessing a prediction model's generalization ability. Out-of-sample $R^2$ is typically defined as $1 - \frac{\sum (y_i - \hat{y}_i)^2}{\sum (y_i - \bar{y})^2}$, where the denominator uses the sample mean as the baseline; when the model predicts worse than simply using the mean, this value drops below 0. The correlation $r$ measures the linear agreement between predicted and true values and is scale-insensitive. The squared relationship between the two does not hold strictly (because the denominator of $R^2$ is fixed to the mean baseline, whereas $r^2$ varies with the variance of predicted values). Which one to report in practice depends on the focus: if absolute prediction error matters, look at $R^2$; if only ranking or association strength matters, look at $r$. Understanding this distinction helps in correctly interpreting the two expected values output by predpower.
OLS and Ridge Regression Under Leave-One-Out Cross-Validation
The paper's analytical framework is based on leave-one-out cross-validation (LOOCV), deriving the expected out-of-sample performance for ordinary least squares (OLS) and ridge regression separately.
For OLS, the closed-form solution reveals how out-of-sample $R^2$ decays as $D^$ deviates from its ideal value. For ridge regression, there is an interaction effect between the choice of regularization parameter and $D^$—in high-leverage data, ridge regression's shrinkage mechanism can partially compensate for the predictive loss caused by imbalance.
Simulation studies validate the accuracy of the formulas under various data-generating mechanisms. The results show that across different degrees of covariate skew and leverage concentration, the deviation between the formula's expected values and actual realized values falls within an acceptable range.
Leave-one-out cross-validation (LOOCV) is the extreme case of $K$-fold cross-validation when $K=N$: each time one observation is held out as the test set, the model is trained on the remaining $N-1$ observations, and after repeating $N$ times the average error is taken. Its advantages include no variance from random partitioning, and for linear models a closed-form solution exists—the LOOCV residual for OLS can be written as $e_i/(1-h_{ii})$, where $h_{ii}$ is precisely the leverage value, which also explains why $D^*$ naturally enters the formula for expected out-of-sample performance. The closed-form solution for ridge regression under LOOCV is similar in form, except that the regularization parameter $\lambda$ is added to the denominator, producing additional shrinkage on high-leverage points. Note that LOOCV has high variance on high-leverage data and may overestimate generalization performance when observations are correlated—a boundary condition to keep in mind when interpreting the formula's conclusions.
Predicting Personality from Smartphone Behavior: A Real-World Case Study
The paper applies the method to a published study—using smartphone behavioral data to predict personality traits. This case study nicely demonstrates the practical value of the design formula.
According to the formula's ex-ante estimation, given the sample size and number of predictors, the expected out-of-sample $R^2$ for OLS is insufficient to exceed the sample-mean baseline—that is, using least-squares regression for prediction is no better than simply using the sample mean as the predicted value. However, the expected performance of ridge regression is able to surpass this baseline.
This conclusion is consistent with the actual analysis results of the published study. If researchers had run this design calculation before collecting data, they would have known in advance to choose ridge regression over OLS, thereby avoiding the need to passively adjust methods during the analysis stage.
Sample-mean baseline refers to the performance achievable by doing no modeling at all and simply predicting all new samples with the training-set $\bar{y}$. For out-of-sample $R^2$, this baseline is exactly 0; for the correlation $r$, if $\bar{y}$ is a constant then the correlation is undefined. Therefore, "OLS cannot exceed the sample-mean baseline" means its expected out-of-sample $R^2$ is less than or equal to 0—i.e., least squares on high-leverage, weak-signal data not only lacks generalization ability but actually performs worse than doing nothing. Ridge regression shrinks coefficients by introducing an $L_2$ penalty, reducing variance in high-leverage scenarios and thereby potentially pushing the expected $R^2$ back above 0. This contrast highlights the necessity of regularization in prediction-oriented research: when the true effect is weak and covariate distributions are imbalanced, defaulting to OLS is a foreseeable trap.
The predpower Toolkit
The paper is accompanied by an R package predpower that implements all of the above calculations. Researchers need only input the four design-stage parameters to obtain estimates of the expected out-of-sample $R^2$ and $r$, along with corresponding confidence intervals.
This toolkit fills a gap in the design stage of prediction-oriented research. For machine learning practitioners and quantitative social science researchers, it provides a systematic method for assessing the feasibility of prediction models before data collection—asking not only "can we detect an effect" but also "can we predict accurately."
One-line Summary
A new paper proposes design formulas for prediction models, using four quantities to ex-ante estimate out-of-sample R² and correlation.
Paragraph Summary
Traditional ex-ante power analysis only answers whether an effect can be detected, but cannot answer how well a model will predict on new samples. The paper proposes closed-form design formulas for prediction models, enabling estimation of the expected out-of-sample R² and observed-predicted correlation r before data collection. The formulas depend on four design-stage quantities: sample size N, number of predictors p, assumed population R², and design efficiency factor D*. D* characterizes the non-uniformity of covariate leverage distribution, making the formula sensitive to data imbalance and skew, breaking through the limitation of classic shrinkage formulas that rely only on N and p. The paper derives the expected performance of OLS and ridge regression separately under the LOOCV framework and validates through simulation. A case study predicting personality from smartphone behavior shows that ex-ante calculation can determine in advance that OLS cannot exceed the sample-mean baseline while ridge regression can. The accompanying R package predpower implements all calculations.
Related articles

OpenAI Partners with Shield: How the Astra Agent Revolutionizes IT Troubleshooting
OpenAI and Shield launch the Astra agent, which autonomously logs into computers and legacy systems to fix IT issues in real time, 35-40% faster than traditional models, with humans involved only when judgment is needed.

iPhone Duo Battery Life Tested: One Charge a Day Is Unavoidable, and the Large Screen Is the Culprit
iPhone Duo battery test: heavy use needs at least one charge a day, and about 30% remains after 6.5 hours of screen-on time. How often the large screen is unfolded is key; a MagSafe battery pack helps, and long-term degradation is also worth watching.

Kimi K3.1 Pro Open-Sourced: 2.8 Trillion Parameters Close In on Opus
Moonshot releases the open-source MoE model Kimi K3.1 Pro, with 2.8T total parameters and 104B activated, trailing Opus 5.5 by under 1 point on Terminal Bench 4.0.