Do AI Stock Pickers Chase Momentum? The Hype Trap Benchmark Tests 9 LLMs

Only GPT-5.4 mini chased momentum in a real-data LLM benchmark, and no model beat random guessing.
A developer built the "Hype Trap" benchmark using live stock scanner data to test whether AI models give higher scores to stocks simply because they've already surged. Testing 9 frontier LLMs from 6 labs on 351 cleaned cases, the results showed only GPT-5.4 mini was statistically confirmed as a run-up chaser (+32.8 extra lift points). No model outperformed the naive baseline of always guessing 31%, with all AUC confidence intervals including 0.5. Causal analysis revealed that chasing behavior stems mainly from penalizing flat stocks rather than rewarding big gainers. The article also exposes extreme methodological sensitivity: changing the starting price definition alone can shrink a key finding from -11.9 points to -0.9.
A developer who built his own stock-scanning system designed a clever real-world benchmark for AI models: after a stock has already surged, will a model grow more bullish on it simply because it ran up — even though the run-up itself has no predictive power over future price direction? This test, dubbed the Hype Trap, exposes a hidden risk that plagues many quantitative tools: AI may simply be echoing price moves that have already happened and passing that echo off as a prediction.
A Benchmark Built on Real Predictions
What makes this test distinctive is that every prediction was logged by a live scanner before the outcome was known. The author ran a stock scanner from February to May 2026, targeting heavily discussed U.S. small-cap stocks mostly priced below $10. The scanner asked an AI to assign a "liftoff" score from 0 to 100, rating a stock's expected momentum over the next one to three days.
One case put the author on alert: a stock surged 60% over five trading days, media headlines screamed "retail mania," and the AI rated it a bullish 72 — but the stock fell more than 5% over the following five days.
This is exactly what the author calls run-up chasing — the more a stock has already risen, the more excited the AI becomes, even though past gains carry no directional signal for what comes next. That observation led to the central question: do today's frontier LLMs still fall into this trap?
Trimming 15,600 Rows Down to 351 Clean Cases
The raw dataset contained 15,606 scoring records. Rigorous cleaning left 351 valid cases. The key filters are worth noting:
- Remove placeholder scores: When an AI step was skipped or failed, the app saved a fixed fallback score as if the AI had actually responded. These phantom data points accounted for 31% of all scored rows and were discarded entirely.
- Remove mismatched news: The scanner fetched news by ticker symbol, but short tickers also match common words, personal names, and foreign-listed companies with the same symbol. About 1-in-10 articles turned out to be about a completely different company and were thrown out.
- All outcomes use official daily closing prices, not the scanner's own trade records, which had bugs.
Each case gave the model exactly two inputs: the stock's price change over the prior five trading days, and a single news snippet with the company name and identifying details stripped out.
Spearman's rank correlation is the key metric in this article. Unlike Pearson correlation, Spearman first converts both variables into ranked orderings, then measures the linear relationship between those ranks — making it more robust to outliers and non-linear relationships. The coefficient ranges from -1 to +1: +1 means one variable's rank always rises with the other, 0 means the rankings are completely unrelated, and -1 means the opposite. In this article, the old AI's scores had a Spearman correlation of +0.55 with prior run-ups — meaning the more a stock had risen, the higher the AI scored it — while prior run-ups had a correlation of roughly 0.00 with future returns, meaning past gains predicted nothing. Together, these two facts form the statistical definition of a "momentum echo."
9 Models, Who Fell into the Trap?
Nine models from six labs participated, including four reasoning models, spanning Qwen3 235B, Claude Haiku 4.5, Claude Opus 5.5, the Gemini series, the GPT-5.4 series, GLM-5, and Grok 4.20. All models used the same prompt, each case opened a fresh conversation, and all were run once with the provider's default settings.

Only One Model Qualifies as a Run-Up Chaser
The test quantifies chasing behavior using extra lift: the number of points a model's score rises from the smallest to the largest run-up, minus how much the actual win rate rises over the same range. A model is only flagged as a chaser if the 95% confidence interval for this value sits entirely above zero.
Out of nine models, GPT-5.4 mini was the only one classified as a run-up chaser, with an extra lift of +32.8 points (interval: +12.4 to +51.6) and a Spearman correlation with prior run-ups of +0.73 — nearly matching the old scanner AI's +0.69. Qwen3 235B Instruct 2507 came in second, showing meaningfully more run-up dependence than the other seven (+18.6 points), but not enough to be formally classified as chasing. The remaining seven models fell within the test's noise range.
In the ">+30% run-up" bucket, average model predictions ranged from Claude Opus 5.5's 27.3% to GPT-5.4 mini's 61.6%, while the actual win rate was 42.8%. Notably, stocks that had already surged more than 30% showed wilder swings in both directions: of the 58 calls in that bucket, 43% went on to gain more than 5%, but 40% also fell more than 5%.
Brier Score and AUC are two standard metrics for evaluating probabilistic predictions. The Brier Score measures the mean squared error between predicted probabilities and actual outcomes — lower is better, with 0 being perfect. The Brier Skill Score normalizes this against a baseline (here: always guessing the base rate of 31%), where 0 means no better than the naive baseline and negative values are worse. AUC (area under the ROC curve) measures how well a model separates positive from negative cases: 0.5 is a random classifier, 1.0 is perfect. In this article, every model's AUC confidence interval includes 0.5, meaning it's statistically impossible to rule out that they perform no better than random — the harshest possible verdict on predictive ability.
Not a Single Model Beats "Always Guess 31%"
If run-up chasing is a bias problem, the predictive accuracy findings are even more sobering: none of the nine models could clearly outperform the naive baseline of always predicting a 31% win rate. Not one demonstrated a meaningful edge at identifying which stocks would actually surge.
The top-ranked model by Brier skill (where 0 = no better than the fixed base rate) was Claude Haiku 4.5 at just +0.013, with a confidence interval still spanning zero. Every model's AUC confidence interval included 0.5. In other words, against these high-volatility small-cap stocks, the frontier models showed no statistically verifiable discriminative ability.
What Happens When You Hide the Run-Up?
The author also designed two "twin tasks" to isolate causality. hype_trap_no_move withholds the run-up number; hype_trap_no_read drops the question asking the model to classify the news type.
For GPT-5.4 mini, hiding the run-up figure caused its extra lift to plummet from +32.8 to just +6.6 points. Interestingly, the mechanism wasn't simply "see a big gain, get more excited": with the number visible, GPT-5.4 mini only raised its score by 4.6 points on stocks that had already surged past 30%, but lowered it by 12.6 points on stocks that had barely moved.
In other words, run-up chasing looks more like "penalizing stocks that haven't moved" than "rewarding stocks that have." Both twin tasks pointed the same direction: the extra run-up sensitivity was driven mainly by lower scores on stocks with flat price histories.
Additionally, the act of asking the model to classify the news type — built into the prompt — caused all three models that ran the no_read variant to lower their average predictions by 1.5 to 6.0 points, actually making them track the run-up more closely. This is a reminder that prompt wording materially changes model behavior.
The Old AI's True Nature: A Momentum Echo
As a reference point, the author analyzed the scanner's own live AI (which defaulted to Claude Sonnet 4.5 with GPT-4o mini as a fallback, though the specific model for each call was never logged). This section is the hardest to reproduce — and the most valuable real-world evidence in the piece.

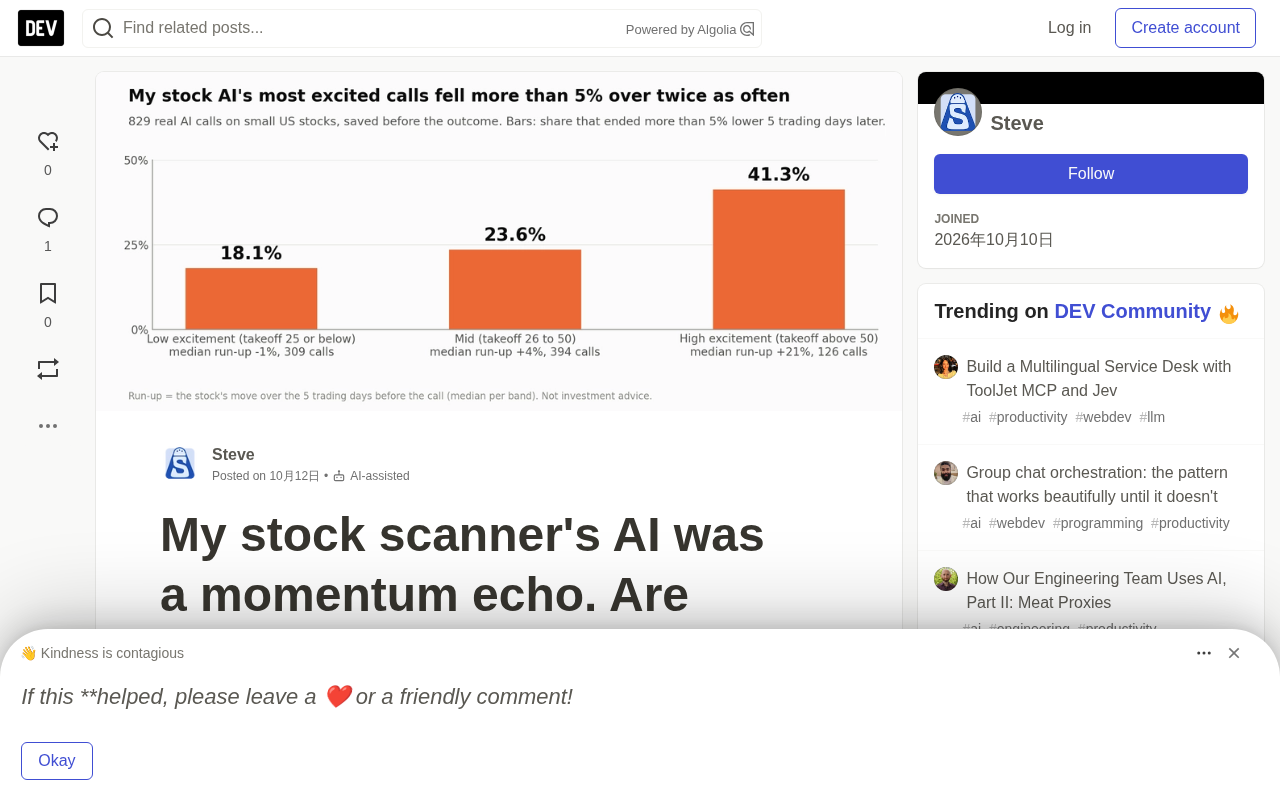
Across all 829 clean calls, the old AI's liftoff scores had a Spearman correlation of +0.55 with prior run-ups, a correlation of only -0.06 with five-day forward returns, and prior run-ups had a correlation of roughly 0.00 with future performance. Its most excited high-score calls subsequently fell more than 5% in 41.3% of cases; its calmest low-score calls fell more than 5% only 18.1% of the time. It looked like prediction; it was just a replay of price history — which is precisely what "momentum echo" means.
A common objection is: "You asked it to judge momentum, so of course it gave you momentum." The author's counter: the question asked about the next one to three days. Following momentum is only useful when past performance predicts future performance — and for these stocks, it simply doesn't.
Price momentum is a well-documented market anomaly in traditional quantitative finance: over longer windows (typically 3 to 12 months), past outperformers tend to continue outperforming. However, this effect often reverses or breaks down entirely over very short windows (1–5 days) and among highly volatile micro-cap stocks, where mean reversion tends to dominate instead. The stocks tested here are exactly that type — hyped, low-priced small caps — and the near-zero correlation between historical run-ups and five-day forward returns confirms that classic momentum logic simply doesn't apply in this context. An AI model that still scores stocks higher based on their recent run-ups is treating a null signal as a predictive input. This is precisely why a "momentum echo" is more dangerous than a genuine momentum strategy.
One Scoring Choice That Almost Erased the Entire Finding
The most thought-provoking section of the article concerns a near-invisible methodological "reversal."

How should the "starting price" for outcome measurement be defined? Using that day's closing price (the author's rule), excited calls had an 11.9-point lower probability of ending higher than calm calls. Using the quoted price at scan time, it was -9.7 points. But using the previous day's closing price, the gap nearly vanishes (-0.9 points). The reason: the prior-close method credits the AI for intraday gains it had already observed — and excited calls happened disproportionately on days when the stock was already moving up during the session.
The author admits: "If I had used that looser scoring method, I would have written a much more flattering article about this AI." The data source also matters enormously — switching from the scanner's own quoted prices to official daily closing prices changed the outcome label for 20.6% of cases and widened the key gap from -6.0 to -11.9 points.
Five Practical Lessons for Anyone Feeding News to LLMs
The author distills five actionable takeaways that are far more broadly valuable than any "which model won" conclusion:
- Log every call before the outcome is known, and record the model name — the author paid the price for not doing this.
- Strip out fallback and placeholder scores before evaluating — they accounted for 31% of the author's data.
- Verify that each news item actually refers to the correct company — roughly 1-in-10 were mismatched here.
- Lock in your starting price definition before you look at the results — that single choice moved a finding from -11.9 to -0.9 points.
- Compare model scores against the run-up the model already saw — if scores rise and fall with prior gains, and prior gains have no predictive power, you have an expensive momentum echo on your hands.
This benchmark produced no champion model. Instead, it delivered a more honest verdict: on the noisy track of heavily hyped small-cap stocks, frontier LLMs struggle just as much as the old AI did to separate signal from noise. The real danger isn't that AI can't predict markets — it's mistaking the echo of a price move for genuine foresight.
Related articles

Gemini 4 Argon Hands-On: AI Builds Board Games, Constructs Temples, and Trains Robots Autonomously
Gemini 4 Argon hands-on roundup: AI autonomously builds a desk racetrack and temple in Blender, writes a ray tracing engine, trains a humanoid robot to sink 7 shots, plus API pricing and developer access.

The Magic Octagonal Coin: Why Only 9% of People Can Predict Its Flip?
Only 9% of people can correctly predict the Magic Octagon coin flip. This article explains its spatial rotation mechanism, common cognitive pitfalls, and a new hypothesis based on Relevance Theory, exploring the limits of human spatial reasoning.

Sam Altman: AI Is Entering the Era of Scientific Discovery — Math Breakthroughs Will Replicate in Biology and Energy
Sam Altman says AI is entering the era of scientific discovery — math breakthroughs will replicate in biology, materials science, and energy to help develop new drugs and energy sources.