GKE GPU Monitoring Blind Spots: Misleading Utilization Metrics and Attribution Errors — A Deep Dive
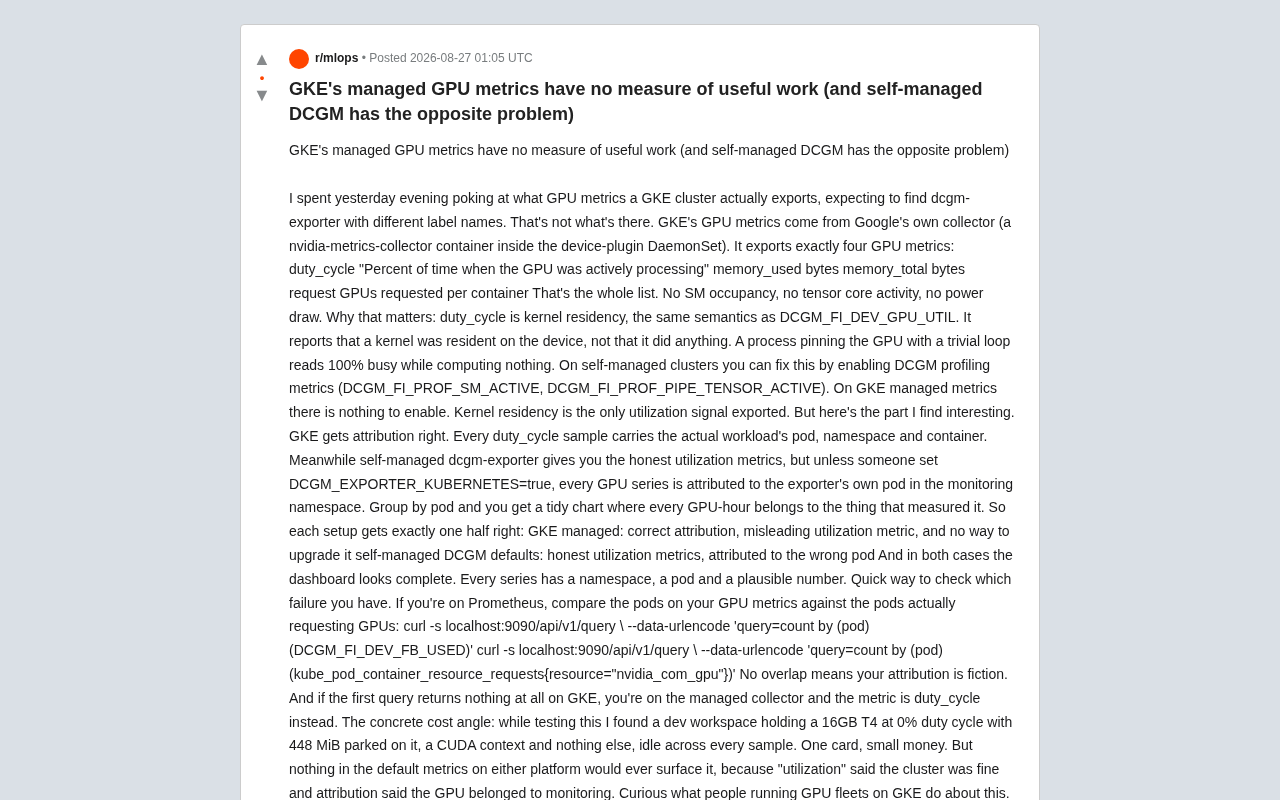
GKE managed GPU metrics and self-hosted DCGM each get only half of monitoring right, creating hidden waste.
GKE's managed GPU metrics nail attribution but only export misleading kernel-residency utilization (duty_cycle), while self-hosted dcgm-exporter provides honest utilization data but misattributes metrics to its own pod by default. This article dissects both failure modes, explains the GPU execution model behind the discrepancies, provides Prometheus diagnostic queries, and offers practical solutions including parallel dcgm-exporter deployment to achieve both accurate attribution and meaningful utilization metrics.
In production GPU clusters, a seemingly simple question is often overlooked: Is your monitoring dashboard actually telling you that your GPUs are doing useful work? After digging deep into GPU metrics exported by GKE (Google Kubernetes Engine), one engineer discovered an unsettling truth — neither the GKE managed solution nor the self-hosted DCGM solution gets the full picture right. Each only does half the job correctly. This article dissects the technical mechanics behind this monitoring blind spot, and the real costs it can incur.
The Truth About GKE Managed GPU Metrics
Many engineers assume that the GPU metrics exported by GKE are simply the industry-standard dcgm-exporter with relabeled tags. Investigation reveals otherwise. GKE's GPU metrics come from Google's own collector — an nvidia-metrics-collector container running inside the device-plugin DaemonSet.
To understand this design choice, you need to know how GKE handles GPU device management. GKE is Google Cloud's managed Kubernetes service, freeing users from managing the control plane. In Kubernetes, hardware accelerators like GPUs are "Extended Resources" that must be registered with kubelet through the Device Plugin mechanism. NVIDIA's Kubernetes Device Plugin runs as a DaemonSet on every GPU node, discovering GPU devices, reporting available quantities to kubelet, and handling GPU mounting and isolation when containers start. GKE deeply customizes this standard mechanism — it injects an additional nvidia-metrics-collector container into the Device Plugin Pod, replacing the community-standard dcgm-exporter with Google's own collection logic. This is the root cause of the metric discrepancies.
It exports a grand total of four GPU metrics:
duty_cycle: Percentage of time the GPU is in an active processing statememory_used: Used GPU memory in bytesmemory_total: Total GPU memory in bytesrequest: Number of GPUs requested per container
That's it. No SM occupancy, no Tensor Core activity, no power consumption data. For teams that need fine-grained GPU workload observability, this metric set is remarkably thin.
The Misleading Nature of duty_cycle
The core issue lies with the duty_cycle metric. Semantically, it's equivalent to DCGM_FI_DEV_GPU_UTIL, which is essentially kernel residency — it reports that a kernel is resident on the device, not that the kernel is actually performing useful computation.
To truly appreciate the severity of this trap, you need to understand the GPU execution model. Computation on NVIDIA GPUs is submitted in units called "kernels" — a kernel is a program that executes in parallel on the GPU. GPU Utilization (DCGM_FI_DEV_GPU_UTIL) measures the percentage of the sampling period during which "at least one kernel is running on the GPU" — this is kernel residency. But a kernel might use only a tiny fraction of the GPU's Streaming Multiprocessors (SMs). Modern NVIDIA GPUs have a large number of SMs — for example, the A100 has 108 SMs and the H100 has 132 SMs — an inefficient kernel might occupy only a few of them while making GPU utilization read 100%. By contrast, DCGM_FI_PROF_SM_ACTIVE measures the proportion of all SMs that are actually in an active computing state, and DCGM_FI_PROF_PIPE_TENSOR_ACTIVE further narrows the focus to the actual usage rate of the tensor compute units most critical for AI training. The granularity gap between these three metrics can be orders of magnitude: a scenario showing 100% GPU Util might have only 15% SM Active and less than 5% Tensor Core Active.
In other words, a process that pins the GPU with a meaningless loop will make duty_cycle read 100% busy while actually computing nothing. This is a classic "looks busy, actually idle" trap. For cost-sensitive GPU clusters, this misdirection can mean massive compute waste going completely unnoticed.
What makes this even more frustrating is that with GKE managed metrics, you cannot enable any finer-grained metrics. Kernel residency is the only utilization signal being exported. On self-managed clusters, you can at least enable DCGM profiling metrics (such as DCGM_FI_PROF_SM_ACTIVE and DCGM_FI_PROF_PIPE_TENSOR_ACTIVE) to get real compute activity data. DCGM (Data Center GPU Manager) is NVIDIA's purpose-built GPU management and monitoring framework for data center scenarios, providing a C API and command-line tools capable of collecting hundreds of GPU runtime metrics spanning temperature, power consumption, ECC errors, NVLink bandwidth, SM activity, Tensor Core utilization, and more. dcgm-exporter is NVIDIA's official Prometheus Exporter that pulls metrics from the DCGM daemon and exposes them in Prometheus format. DCGM's metric hierarchy has multiple tiers: basic metrics can be collected with no additional overhead, while Profiling-level metrics (identified by the DCGM_FI_PROF_ prefix) use GPU hardware performance counters that provide precise SM-level and functional pipeline-level activity data, but may conflict with certain third-party profiling tools.
The GPU Monitoring Attribution Problem: The Other Half of the Failure
Interestingly, GKE gets attribution right. Every duty_cycle sample carries the actual workload's pod, namespace, and container information. In other words, you can accurately tell which business workload is using which GPU.
Self-hosted dcgm-exporter gets this exactly backwards. It gives you honest utilization metrics, but unless someone has explicitly set DCGM_EXPORTER_KUBERNETES=true, every GPU time series gets attributed to the exporter's own pod (typically in the monitoring namespace). Group by pod, and you'll get a "clean" chart — every GPU-hour belongs to the component measuring it, not the actual consumer.
The technical root cause lies in how metric attribution works in Kubernetes. In the Kubernetes observability ecosystem, "attribution" means associating resource consumption metrics with the correct workload entities (Pod, Namespace, Container). Prometheus achieves this through labels. When dcgm-exporter is deployed as a DaemonSet, Prometheus's service discovery mechanism automatically attaches Pod metadata labels to its collected metrics. But there's a subtle catch: by default, these labels reflect the exporter's own Pod identity, not the business Pod actually using the GPU. For correct attribution, dcgm-exporter needs to actively query kubelet's Pod Resources API (enabled by setting DCGM_EXPORTER_KUBERNETES=true), which returns the list of devices assigned to each container, thereby mapping GPU device IDs to business Pods. GKE's managed collector gets attribution right precisely because it runs inside the Device Plugin and has native access to device allocation information without additional configuration.
The Half-Right, Half-Wrong Monitoring Dilemma
This creates an elegantly ironic contrast:
| Solution | Attribution Accuracy | Utilization Metrics | Upgradability |
|---|---|---|---|
| GKE Managed | ✅ Correct | ❌ Misleading | ❌ Cannot upgrade |
| Self-hosted DCGM (default) | ❌ Incorrect | ✅ Honest | ✅ Configurable |
The most dangerous part: In both cases, the dashboard looks perfectly complete. Every time series has a namespace, a pod, and a plausible-looking number. Everything appears normal on the surface while hiding distinct pitfalls underneath.
How to Quickly Diagnose Your GPU Monitoring Failure Mode
If you're using Prometheus, compare the pods on your GPU metrics against the pods actually requesting GPUs:
curl -s localhost:9090/api/v1/query \\
  --data-urlencode 'query=count by (pod) (DCGM_FI_DEV_FB_USED)'

curl -s localhost:9090/api/v1/query \\
  --data-urlencode 'query=count by (pod) (kube_pod_container_resource_requests{resource="nvidia_com_gpu"})'
The diagnostic logic is straightforward:
- No overlap between the two result sets → Your attribution is fictional (self-hosted DCGM attribution problem).
- The first query returns nothing on GKE → You're using the managed collector, and your metrics are
duty_cyclerather than DCGM series (GKE utilization blind spot).
This simple comparison helps ops teams quickly identify which pitfall they've fallen into.
The Real Cost of GPU Idle Waste
Theoretical problems eventually show up on the bill. During testing, a classic case was discovered: a development workspace holding a 16GB T4 GPU with duty_cycle at 0%, sitting on 448 MiB of memory and a CUDA context, doing absolutely nothing — idle at every single sample point.
To understand the resource impact, some background on CUDA contexts is needed. A CUDA Context is a core concept in GPU programming, analogous to a process address space on a CPU. When an application initializes the CUDA runtime, it creates a context on the GPU, and this operation alone consumes a certain amount of GPU memory — typically ranging from tens to hundreds of MiB depending on the GPU model and CUDA version. The 448 MiB memory usage plus one CUDA context described here is a textbook pattern: a developer launched a Jupyter Notebook or debug process, loaded the CUDA runtime and possibly a deep learning framework, and then left it sitting there. The GPU performs zero computation (duty_cycle is 0%), but the memory being occupied means this GPU cannot be scheduled by Kubernetes to other Pods — because Kubernetes GPU scheduling is an exclusive whole-card allocation (unless a GPU sharing scheme like MIG or Time-Slicing is in use). At Google Cloud's on-demand pricing, this T4 costs roughly $0.35/hour, $8.40/day, or approximately $252/month — for doing nothing.
One card, small money. But the real problem is: Under the default metrics of either platform, this waste will never surface. Because "utilization" tells you the cluster is fine, while "attribution" tells you this GPU belongs to the monitoring component. When cluster scale grows to dozens or hundreds of GPUs, this kind of hidden waste quickly accumulates into significant costs.
Solutions for GPU Cluster Operators
This case reveals a deeper observability principle: The presence of metrics does not equal the presence of insight. A complete-looking dashboard might be masking systematic bias in two different directions.
For teams running GPU clusters on GKE, viable approaches include:
- Deploy your own dcgm-exporter in parallel: Supplement the managed collector with a properly configured dcgm-exporter alongside it. This gets you both real utilization metrics and correct attribution via
DCGM_EXPORTER_KUBERNETES=true— the best of both worlds. The key to this approach is ensuring dcgm-exporter can access kubelet's Pod Resources API (typically requiring mounting the/var/lib/kubelet/pod-resourcessocket) and enabling Profiling-level metric collection in the DCGM configuration file. Note that Profiling metrics will occupy GPU hardware performance counters, which may conflict if your workloads simultaneously use NVIDIA Nsight Systems or Nsight Compute for performance analysis. - Accept the blind spots and build compensating mechanisms: If you insist on using only managed metrics, at least be aware of
duty_cycle's limitations and cross-reference with auxiliary signals like memory usage and CUDA context detection. For example, set up alert rules that trigger an idle GPU warning when a Pod's GPU memory usage is consistently above zero butduty_cycleremains at zero beyond a certain time threshold. This heuristic approach isn't as precise as SM Active, but it catches the most obvious waste scenarios. - Explore deeper Cloud Monitoring capabilities: It's possible that Google has underutilized metric interfaces within the Cloud Monitoring ecosystem that haven't been fully explored.
Regardless of which path you choose, the critical first step is acknowledging that default monitoring might be lying to you. In an era of sky-high GPU costs, a single idle GPU card misreported as "busy" or attributed to the wrong owner is real money down the drain. Periodically auditing your cluster with the diagnostic queries above might be the lowest-cost cost optimization strategy available.
Key Takeaways
Related articles

Trump's Request to Rename the Atlantic Rejected by Google; 1Password Lets AI Agents Log In Securely
The Vergecast roundup: Trump's request to rename the Atlantic the 'Trump Ocean' was politely declined by Google's CEO; 1Password's new feature lets AI agents log into accounts without touching passwords; OPPO launches the world's first 200-megapixel phone, the Find X10 Pro Max. All three point to the boundaries of tech authorization and trust.

The Truth About American College Party Culture: The Risks Schools Won't Admit
Behind American college party culture, the administration's "don't ask, don't tell" attitude is amplifying freshman risks. This article analyzes how the pandemic strengthened Greek dominance, freshmen's difficulty accessing safety information, and the chain reactions caused by a culture of denial.

OpenAI Reportedly Raising $30B at $1.25T Valuation Ahead of IPO
OpenAI is planning a $30B funding round at a possible $1.25T valuation, paving the way for an IPO. If completed, it would set a private company valuation record. This article analyzes the funding size, pre-IPO logic, and industry signals.