Great Expectations vs Evidently: A Guide to Choosing the Right Data Quality Tool

A comprehensive comparison of Great Expectations and Evidently for data quality tool selection.
This guide compares Great Expectations and Evidently, two leading open-source data quality tools. Great Expectations excels at declarative rule-based data validation (the "gatekeeper"), while Evidently focuses on statistical drift monitoring and ML model observability (the "observer"). The article covers null checks, anomaly detection, pipeline integration, learning curves, and provides a decision framework to help data teams choose — or combine — the right tool for their needs.
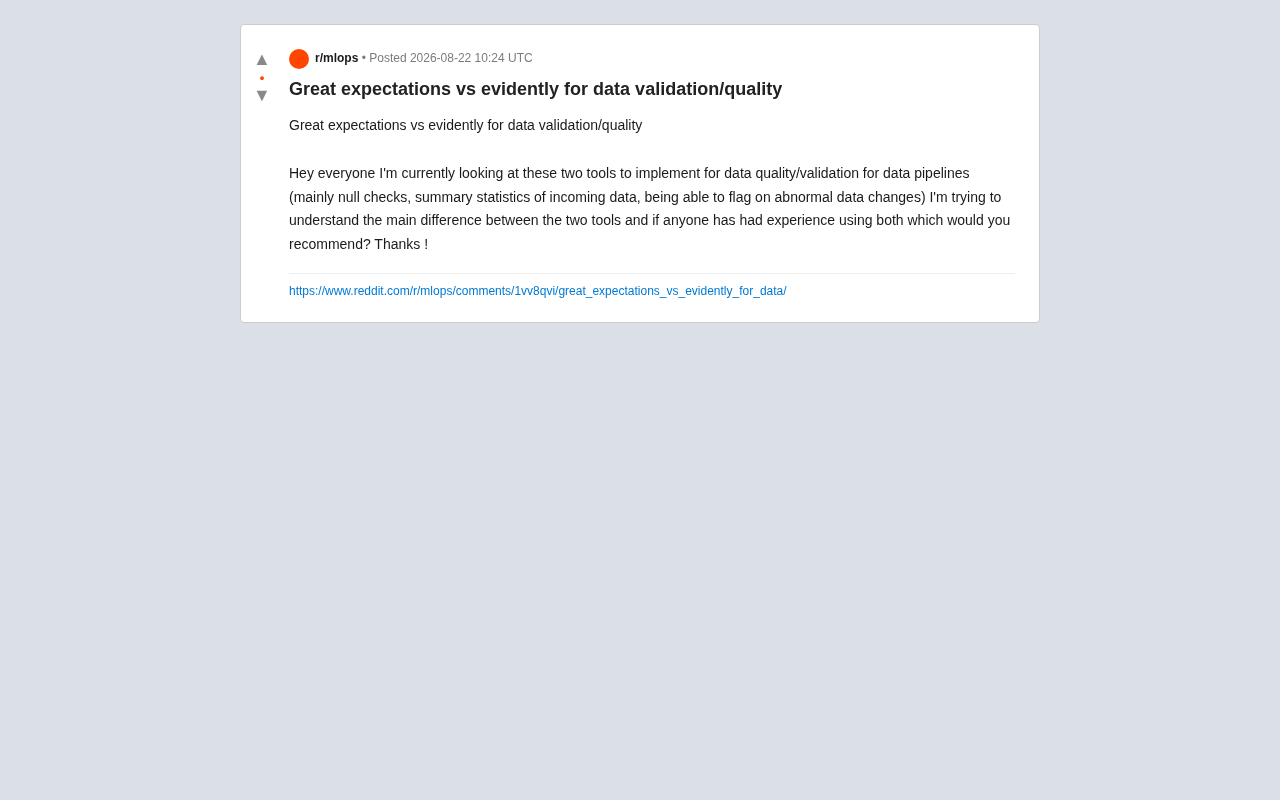
When building modern data pipelines, data quality and validation are unavoidable core concerns. Null checks, statistical summaries, monitoring for anomalous data changes — these seemingly basic requirements form the first line of defense for data reliability. Recently, a hot topic in the Reddit data engineering community sparked widespread discussion: Great Expectations vs Evidently — how should you choose?
In reality, data quality issues have long ceased to be technical debt you can "deal with later." According to Gartner research, poor data quality costs organizations an average of $12.9 million per year. With the rise of Data Observability — a concept borrowed from DevOps observability in software engineering that emphasizes comprehensive monitoring of data Freshness, Distribution, Volume, Schema, and Lineage — the industry's demand for data quality tools has evolved from simply "checking for errors" to "continuously understanding the health of your data." It is against this backdrop that Great Expectations and Evidently each offer their own solutions from different entry points.
This article provides an in-depth analysis of the design philosophies, use cases, and core differences between these two leading open-source data quality tools, helping you make smarter decisions in real-world projects.
Positioning Differences Between Great Expectations and Evidently
Although Great Expectations (commonly abbreviated as GE) and Evidently are often compared side by side, their original purposes are not entirely the same. Understanding this is a prerequisite for making the right choice.
Great Expectations is a tool focused on Data Validation. Its core philosophy is to let you define "expectations" for your data in a declarative manner — for example, "a certain column cannot have null values," "a numeric value must fall within a specific range," or "the number of unique values in a column should be greater than N." These expectations are validated one by one as data flows through the pipeline, triggering alerts or halting the process upon any violation.
The term "declarative" here refers to a programming paradigm as opposed to "imperative" programming. In the imperative approach, you write step-by-step code to check each rule (e.g., writing a Python script to iterate through every row to detect nulls); the declarative approach only requires you to describe "what conditions the data should satisfy," with the framework handling the execution logic internally. This design not only makes rule definitions more concise and readable but also turns data validation rules into versionable, shareable "Data Contracts" — formal agreements between data producers and consumers about data format and quality. In GE's architecture, these rules are organized into Expectation Suites, which work together with Datasources and Checkpoints to form a complete validation workflow.
Evidently leans more toward data and model Monitoring, especially in machine learning scenarios. It excels at detecting Data Drift, Target Drift, and model performance degradation, generating intuitive visual reports. In other words, Evidently's strength lies in "discovering how data has changed over time."
Data Drift is a core challenge in machine learning engineering. In simple terms, ML models learn patterns based on the data distribution seen during training. When the data distribution in production diverges significantly from the training data, the model's prediction accuracy declines — this is known as "model performance degradation." For example, a recommendation model trained on pre-pandemic consumer data would perform poorly during the pandemic when consumption patterns shifted dramatically. Data drift can occur at the input feature level (Feature Drift) or at the prediction target level (Target Drift, also known as Concept Drift), both of which materially impact model reliability.
One Is a "Gatekeeper," the Other an "Observer"
To sum it up with a simple analogy: Great Expectations is more like a "gatekeeper" in the data pipeline, performing strict rule validation before data enters downstream systems; Evidently is more like an "observer," continuously monitoring the evolution of data distributions, paying special attention to statistical changes that are hard to capture with fixed rules.
Core Feature Comparison: Data Validation and Anomaly Detection
Returning to the original question: the core needs are null checks, statistical summaries of incoming data, and flagging anomalous data changes. Let's analyze these one by one.
Null Checks and Statistical Summaries
Both tools can handle null checks and basic statistical summaries, but they approach them differently:
-
Great Expectations provides a rich set of built-in assertions such as
expect_column_values_to_not_be_nullandexpect_column_mean_to_be_between, making it ideal for clear, enumerable rule validation. GE currently includes over 300 built-in Expectation types, covering everything from simple null and type checks to complex multi-column correlation validations. It can also auto-generate Data Profiling, inferring an initial set of expectations from sample data, reducing the cost of writing rules from scratch. This feature is especially valuable when facing large datasets with hundreds of columns — manually writing rules for every column is both time-consuming and error-prone. -
Evidently uses its Data Quality report module to automatically calculate missing value ratios, distribution characteristics, correlations, and other metrics for each column, presenting them in visual form. Its reports are in interactive HTML format, supporting intuitive comparison between a Reference Dataset and a Current Dataset. This approach is better suited for an "look at the big picture first, then define rules" exploratory workflow, especially in the early stages of a project when all data quality rules haven't been defined yet, helping teams quickly build a holistic understanding of their data.
Flagging Anomalous Data Changes
This is precisely where the two tools diverge. If "anomalous data changes" refers to shifts in data distribution over time (e.g., a column's mean suddenly spikes, or the structure of a categorical distribution changes), then Evidently is the more natural choice. It includes multiple built-in statistical tests (such as the KS test, chi-squared test, PSI, etc.) to quantify the degree of drift, detecting anomalies without requiring manually set thresholds.
These statistical test methods each have their applicable scenarios, and understanding their principles helps you better interpret Evidently's reports:
-
KS Test (Kolmogorov-Smirnov Test): A non-parametric test that determines whether two samples come from the same distribution by comparing the maximum distance between their cumulative distribution functions (CDFs). It's particularly effective for continuous numerical features, capturing overall changes in distribution shape rather than just shifts in mean or variance.
-
Chi-squared Test: Primarily used for categorical variables, it determines whether a categorical distribution has changed significantly by comparing actual observed frequencies against expected frequencies. For example, when a user geographic distribution on an e-commerce platform shifts from "60% in tier-1 cities" to "40% in tier-1 cities," the chi-squared test can effectively detect this change.
-
PSI (Population Stability Index): A widely used metric in financial risk management that measures the stability of a variable's distribution across two time periods. Typically, PSI < 0.1 indicates a stable distribution, 0.1–0.25 suggests the need for attention, and > 0.25 indicates a significant distribution shift that may require model retraining.
Evidently automatically selects the appropriate test method based on each feature's data type, while also allowing users to customize test strategies and thresholds, balancing ease of use with flexibility.
Conversely, if "anomalies" refer to violations of explicit business rules (e.g., prices cannot be negative, dates cannot be in the future), then Great Expectations' declarative assertions are more direct and controllable.
Integration Capabilities and Engineering Considerations
Beyond functionality itself, a tool's integration capabilities within data pipelines deserve equal attention.
Great Expectations has a high level of maturity within the data engineering ecosystem, with solid integration support for Airflow, dbt, Spark, and various data warehouses.
These integration partners each play different roles in the data pipeline: Apache Airflow is currently the most mainstream Workflow Orchestration tool, responsible for defining and scheduling the execution order and dependencies of tasks in a data pipeline — GE can serve as a task node within an Airflow DAG, automatically running validations before and after data processing; dbt (Data Build Tool) is the standard tool for the data transformation layer, primarily used for writing and managing SQL transformation logic — GE's integration with dbt means you can automatically validate outputs after each data transformation; Apache Spark is a large-scale distributed data processing engine — GE's native support for validating Spark DataFrames is crucial for teams handling TB-scale data.
GE also offers Data Docs, which automatically generates human-readable validation result documentation for team collaboration and auditing. Data Docs renders each validation result into a polished static website, including pass/fail status for every Expectation, specific data statistics, and historical trends. This feature is particularly useful when presenting data quality status to non-technical stakeholders or providing data quality evidence during compliance audits. It also ties back to the "Data Contract" concept mentioned earlier — Data Docs is essentially the visual execution report of data contracts.
However, GE's configuration is relatively complex. Early versions had a steep learning curve, and the project structure (Checkpoints, Datasources, Expectation Suites) requires time to understand. It's worth noting that GE released version 1.0 (codenamed GX) in late 2023, which significantly simplified the API and configuration process by introducing a more intuitive Fluent Datasource API, substantially lowering the barrier to entry. If you previously abandoned GE due to configuration complexity, it's worth re-evaluating.
Evidently has a lower barrier to entry — a few lines of code can generate a complete monitoring report, making it ideal for quickly validating ideas or embedding into ML workflows. It supports both batch reports and real-time monitoring services (Evidently Cloud / self-hosted), delivering an especially smooth experience in MLOps scenarios.
MLOps (Machine Learning Operations) is a methodology that applies DevOps principles and practices to machine learning systems. Its core objective is to achieve efficient, reliable, and sustainable lifecycle management of ML models from experimentation to production. In the MLOps tech stack, model monitoring is a critical component — a model in production is not "set and forget" but requires continuous observation of changes in its input data and outputs. Evidently's positioning in this area is highly precise: it not only detects data drift but also correlates drift signals with model performance metrics (such as accuracy, AUC, RMSE, etc.), helping teams determine whether "the data changed" actually caused "the model got worse," and thus decide whether to trigger a model retraining pipeline. Evidently also supports integration with mainstream MLOps ecosystem tools like MLflow, Grafana, and Prometheus, forming a complete closed loop from data monitoring to alert response.
Learning Curve and Team Fit
Based on community feedback, for pure data engineering teams (data movement, ETL, warehouse construction), Great Expectations' rule-driven model aligns better with existing engineering habits; for data science or ML teams, Evidently's drift monitoring and visualization capabilities are more attractive.
This difference in team fit is also reflected in their tech stack preferences. Data engineering teams typically work primarily with SQL and orchestration frameworks — GE's native support for SQL data sources and deep integration with orchestration tools matches this workflow. Data science teams, on the other hand, are more accustomed to interactive exploration in Jupyter Notebooks — Evidently conveniently provides the ability to render reports directly within Notebooks, letting monitoring and analysis seamlessly integrate into data scientists' daily workflows.
How to Make Your Choice: A Decision Framework
Overall, the key to your choice lies in whether your core pain point is "rule validation" or "change monitoring."
-
If your data pipeline has a large number of clear, enumerable business rules that need to be enforced, and you want to "block" non-conforming data before it enters downstream systems, prioritize Great Expectations.
-
If you're more concerned about data distribution drift over time and need continuous visual monitoring — especially in machine learning pipelines — prioritize Evidently.
-
If budget and resources allow, the two are not mutually exclusive. A common mature practice is to use Great Expectations for hard rule validation within the pipeline (gatekeeping) and Evidently for long-term distribution drift monitoring (observing). The combination covers the full spectrum from deterministic rules to statistical anomalies.
Additionally, it's worth mentioning that if your scenario is very simple (e.g., you only need basic not-null and uniqueness checks for dbt models), dbt's built-in tests or lighter-weight tools like Soda are also worth considering, to avoid introducing overly heavy frameworks for simple needs. The golden rule of tool selection remains: solve the current core problem with minimal complexity while leaving room for future expansion.
Summary
There is no absolute "best" choice for data quality tools — only the "best fit." Understanding the design philosophies of Great Expectations and Evidently — one being a declarative rule gatekeeper, the other a statistically-driven change observer — is what truly lets tools serve your data pipeline, rather than being constrained by their feature lists. Before formally adopting either, we recommend running a quick POC (Proof of Concept) with a small segment of real data in each tool to experience the workflow differences firsthand — that's often more persuasive than any review.
Related articles

Chain of Thought Isn't Just for AI: How Humans Can Use CoT to Improve Thinking Quality
Chain of Thought isn't just a prompt trick for large models. Starting from a Hacker News discussion, this article analyzes why CoT works for human thinking too, breaks down actionable ways to transfer it, and highlights the key differences between human CoT and machine CoT.
Cloudflare Teams Up with OpenAI: Closi…
Cloudflare Teams Up with OpenAI: Closing the Loop from Vulnerability Discovery to Defense with AI
Cloudflare uses OpenAI Daybreak to investigate security vulnerabilities and generate reviewable remediation plans, while developers use Codex to boost coding efficiency and quality.

Orca Multi-Agent Orchestration in Practice: A Guide to Parallel Collaboration with Claude and Codex
Orca is Stable AI's free open-source agent workbench supporting 34 agents like Claude Code and Codex in parallel. Learn its Git worktree isolation, multi-model orchestration, and mobile management.