How to Tell If Your GPU Is Out of VRAM When Running Local LLMs: A Complete Guide to VRAM Monitoring

Detect local LLM VRAM overflow by monitoring shared GPU memory usage and learn how to prevent it.
The key to detecting VRAM overflow when running local LLMs is checking whether total GPU memory usage exceeds your physical VRAM capacity—the critical indicator is shared GPU memory being heavily utilized, not just dedicated VRAM. After overflow, inference speed drops dramatically due to RAM bandwidth being roughly 10x lower than VRAM bandwidth. Effective prevention strategies include choosing appropriate model sizes for your VRAM, using quantized models like Q4_K_M, and reducing context length.
Introduction
More and more developers and AI enthusiasts are deploying large language models locally, but VRAM management remains an unavoidable core challenge. Running out of VRAM—commonly called "VRAM overflow" or "OOM (Out of Memory)"—causes model inference speed to plummet, severely degrading the user experience. So how do you accurately determine whether your GPU has run out of VRAM? This article walks you through the detection methods and key considerations based on real monitoring interfaces.
Dedicated GPU Memory vs. Shared GPU Memory: Understanding the Two Concepts First
In Windows Task Manager or GPU monitoring tools, you'll see two VRAM-related metrics: Dedicated GPU Memory and Shared GPU Memory. Many people confuse these two concepts, leading to misdiagnosis.
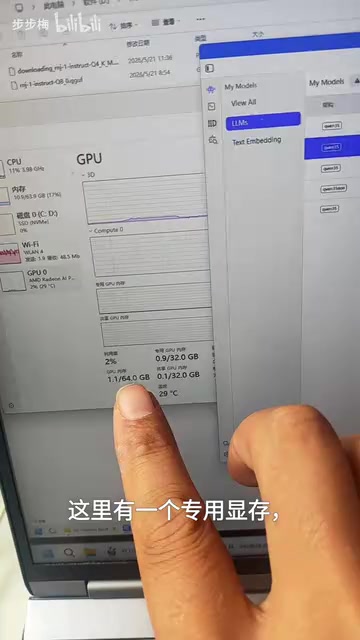
Dedicated GPU Memory
Dedicated GPU memory is the physical VRAM actually installed on your graphics card. For example, if your GPU is rated at 32GB of VRAM, then the dedicated GPU memory cap is 32GB. This value will never exceed your GPU's physical VRAM capacity—it can't go negative, nor can it be maxed out beyond its upper limit.
It's worth understanding that VRAM consists of high-speed memory chips soldered directly onto the GPU PCB, connected to the GPU compute cores via an extremely wide memory bus (for example, NVIDIA's high-end cards can have bus widths up to 5120-bit), offering ultra-low latency and extremely high bandwidth. This tight physical connection is the hardware foundation that enables GPUs to process large-scale matrix operations at high speed.
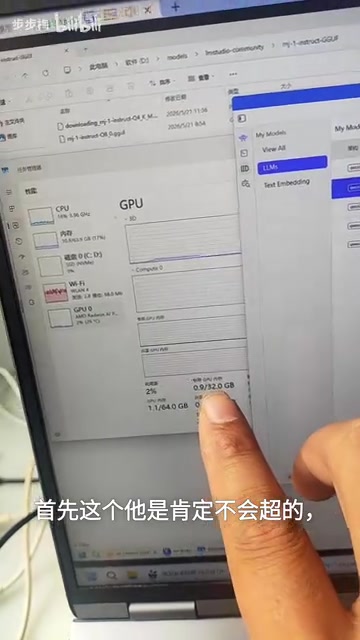
Shared GPU Memory (The Key to Detecting VRAM Overflow)
Shared GPU memory is a portion of system RAM allocated by the OS for GPU use. When dedicated VRAM runs out, the system automatically offloads some data to shared GPU memory—this is what's known as "VRAM overflow," i.e., running out of VRAM.
System RAM communicates with the GPU through the PCIe bus. PCIe 4.0 x16 has a theoretical bandwidth of about 32GB/s, which pales in comparison to VRAM's bandwidth of several hundred GB/s. This architectural difference means that once data spills over to shared memory, the performance loss is structural and cannot be fully compensated through software optimization.
Key takeaway: To determine whether you've run out of VRAM, don't just look at dedicated VRAM usage—focus on whether shared GPU memory is being heavily utilized.
Three Steps to Determine If Your VRAM Has Overflowed
Using a 32GB VRAM GPU as an example, open the "Performance" tab in Task Manager and find the GPU section:
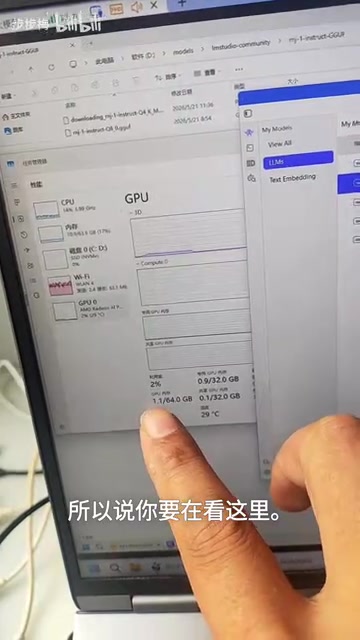
Step 1: Check dedicated GPU memory usage. If it's approaching or has reached 32GB, your VRAM is nearly exhausted—you're in the danger zone.
Step 2: Check shared GPU memory usage. If this value is noticeably non-zero and continuously growing, VRAM overflow has already begun.
Step 3: Check total GPU memory usage. If total usage exceeds your physical VRAM capacity (e.g., exceeds 32GB), you can confirm—your VRAM has indeed overflowed.
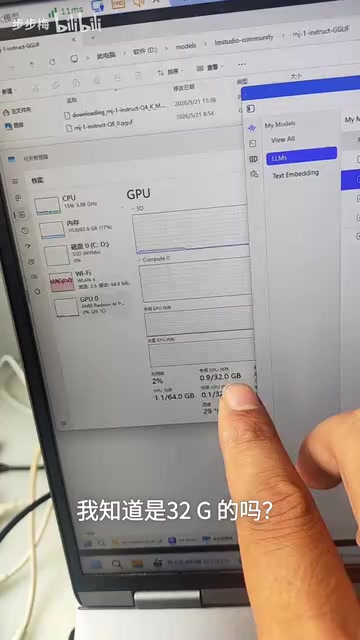
Advanced Monitoring Tip: Windows Task Manager shows an OS-level memory allocation view, which has certain limitations. For NVIDIA GPU users, a more precise approach is using the
nvidia-smicommand-line tool—it reads driver-level data directly and can display exact per-process VRAM usage (in MB), GPU utilization, memory bandwidth utilization, and other fine-grained metrics. Runningnvidia-smi dmonprovides real-time monitoring data refresh, which is especially reliable in multi-process GPU-sharing scenarios.
Why Speed Drops Off a Cliff After VRAM Overflow
The most noticeable effect after VRAM overflow is a dramatic drop in inference speed. The reason is simple: RAM bandwidth and VRAM bandwidth are on completely different levels.
| Storage Type | Typical Bandwidth |
|---|---|
| GDDR6X VRAM | 500GB/s ~ 1TB/s |
| DDR5 RAM | 50 ~ 80GB/s |
The difference is roughly 10x. Once data is frequently shuttled back and forth between RAM and VRAM, inference speed can drop from dozens of tokens per second to just a few tokens per second—a terrible experience.
The essence of this performance loss is the Memory Wall problem: LLM inference is a typical memory-bandwidth-intensive task where GPU compute cores often sit idle waiting for data, and the bandwidth bottleneck directly determines the upper limit of inference throughput.
Practical Tips to Avoid VRAM Overflow
Choose Models Based on Your VRAM Capacity
Different VRAM capacities support vastly different model specifications—choosing wrong is simply wasting time:
| VRAM Capacity | Recommended Model Specs |
|---|---|
| 8GB | 7B models (Q4 quantization) |
| 16GB | 7B ~ 14B models (Q4 ~ Q8 quantization) |
| 24GB | 14B ~ 32B models (Q4 ~ Q6 quantization) |
| 32GB | 32B ~ 70B models (Q4 quantization) |
Prioritize Quantized Models
Quantization is the most direct and effective method to reduce VRAM usage. Its core principle is compressing model weights from high-precision floating point (e.g., FP32, BF16, where each parameter occupies 16~32 bits) to low-bit integer representations. Taking Q4 quantization as an example, each weight parameter is compressed from 16 bits to 4 bits, theoretically shrinking model size by approximately 75%.
The commonly seen Q4_K_M in GGUF format employs a Group Quantization strategy: weights are divided into small groups, each with independently calculated scale factors and zero points, achieving a better balance between compression ratio and precision loss. In practical testing, Q4_K_M typically shows perplexity loss within 1%~3% compared to FP16, which is virtually imperceptible for most everyday tasks. Common quantization formats include Q4_K_M, Q5_K_M, Q8_0, etc.—lower numbers mean lower precision but also less VRAM consumption. For users with tight VRAM budgets, Q4_K_M offers the best balance between precision and VRAM usage.
Reduce Context Length Appropriately
Context length is also a major VRAM consumer, and the underlying mechanism is closely related to the Transformer architecture's KV Cache.
KV Cache is a core mechanism for accelerating autoregressive inference—it caches the Key and Value matrices from each attention layer's computation, avoiding redundant calculations for historical tokens. However, this cache grows proportionally with context length: expanding context from 4K to 8K nearly doubles the KV Cache's VRAM footprint. For a 70B parameter model, an 8K context's KV Cache can consume several additional GB of VRAM.
Therefore, if you don't need to process extremely long texts, reducing the context length from the default 8K or higher down to 4K or 2K can noticeably reduce VRAM usage. When VRAM is tight, this adjustment is often more immediately effective at relieving VRAM pressure than switching to a lower quantization level.
Conclusion
The core method for determining whether your local LLM has overflowed VRAM can be summarized in one sentence: Check whether total GPU memory usage exceeds your GPU's physical VRAM capacity. Once it does, the system automatically uses shared memory to compensate, but the cost is a significant drop in inference speed.
Before deploying a model, it's recommended to choose an appropriate model size and quantization level based on your VRAM capacity, keeping VRAM usage within 90% of physical VRAM whenever possible. This is the way to achieve a smooth local LLM inference experience.
Related articles
 Tutorials
ChatGPT Plus Subscription Guide: Are GPT-5.5, image-2, and Codex Worth the Upgrade?
A detailed look at ChatGPT Plus features — GPT-5.5, image-2, and Codex — with a Plus vs Pro comparison and a complete step-by-step subscription guide for users outside the US.
 Tutorials
Harness AI Engineering in Practice: Using Claude Code to Master Enterprise-Level E-Commerce Development
Deep dive into Harness AI Engineering: master enterprise e-commerce development with Claude Code using the Rules, Skills, Wiki, and Changes framework.
 Tutorials
Cursor + Codex Dual-IDE Collaboration: A Practical Methodology for Open-Source Project Customization
A complete methodology for open-source project customization based on real-world experience, detailing the Cursor+Codex dual-IDE workflow, seven-stage process, MVP validation, and AI source code reading techniques.