MLflow Hands-On Tutorial: A Full-Stack MLOps Guide for GenAI Tracing + Classic ML Tuning

A hands-on guide to MLflow's core features for GenAI and classic ML scenarios.
MLflow is an open-source MLOps platform by Databricks that manages the full AI project lifecycle from experimentation to production. This article covers its GenAI capabilities—auto tracing built on the OpenTelemetry standard (enabling request tracing, token consumption, and latency stats with just three lines of code) and model evaluation using the LLM-as-Judge paradigm with built-in, guideline, and custom scorers—as well as classic machine learning experiment management and model governance.
MLflow is an open-source AI engineering platform, also known as an MLOps toolkit. It covers the entire model lifecycle, including monitoring, evaluation, analysis, debugging, and deployment. This article provides a systematic walkthrough of MLflow's core use cases across two major scenarios—GenAI (LLMs/Agents) and classic machine learning—based on a comprehensive hands-on tutorial.
What Is MLflow? Why Do You Need It?
MLOps (Machine Learning Operations) is the practice of bringing DevOps principles into machine learning engineering. Traditional software CI/CD pipelines manage code versions, but ML systems must simultaneously manage data versions, model weights, hyperparameter configurations, and experiment results—the combinatorial explosion across these four dimensions makes manual tracking nearly impossible. According to Gartner, over 85% of AI projects fail to move from the lab to production, and one of the root causes is the lack of systematic experiment management and model governance tools. MLflow was open-sourced by Databricks in 2018 precisely to fill this gap.
MLflow serves two worlds simultaneously: GenAI (large language models, Agents, Prompt engineering) and classic machine learning (model training and tuning with frameworks like Scikit-learn and PyTorch). In the top-left corner of the MLflow dashboard, you can switch between these two modes at any time.
The core problem it solves is: when models move from the experimentation phase to production, how do you systematically trace every request, evaluate model quality, manage Prompt versions, perform hyperparameter tuning comparisons, and register and deploy the best models? These are the most critical steps in the MLOps workflow.
Environment Setup
Project setup is straightforward: choose a directory, install dependencies like mlflow, openai, langchain-openai, and mistralai, and manage API keys through a .env file. Starting the MLflow service requires just one command:
mlflow server
Once the service is running, navigate to localhost:5000 in your browser to access the MLflow dashboard.
GenAI Scenario: Auto Tracing & Evaluation
Auto Tracing
One of MLflow's most practical features is the simplicity of auto tracing. Taking a standard OpenAI call as an example, you only need to add three lines of code to enable full request tracing:
import mlflow
mlflow.set_tracking_uri("http://localhost:5000")
mlflow.openai.autolog()
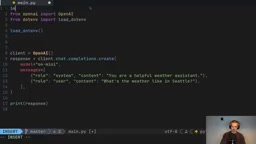
MLflow's auto tracing is built on the OpenTelemetry standard under the hood. OpenTelemetry is an observability specification led by the CNCF (Cloud Native Computing Foundation), defining three pillars: Traces, Metrics, and Logs. In LLM applications, a single user request may trigger multiple rounds of LLM calls, tool invocations, and vector retrievals, forming a tree-shaped call chain. MLflow records each node as a Span, fully reconstructing the request's execution path. Token consumption tracking is particularly important—GPT-4o has different pricing for input/output tokens, and precise token statistics serve as the foundational data for cost control and ROI analysis.
After execution, the Traces page in the MLflow dashboard displays complete information for each request: token consumption (input/output), latency, cost estimates, and more. The Overview tab also provides aggregated statistics, including P99 and P90 latency percentiles—invaluable for negotiating SLAs (Service Level Agreements) in production environments.
For frameworks like LangChain and Mistral, switching is equally simple—just replace mlflow.openai.autolog() with mlflow.langchain.autolog() or mlflow.mistral.autolog().
Model Evaluation
Evaluating LLM output quality is one of the most challenging problems in GenAI engineering. Traditional NLP metrics (such as BLEU and ROUGE) rely on literal matching against reference answers and cannot capture semantic equivalence. MLflow's evaluation framework adopts the LLM-as-Judge paradigm—using a stronger model (typically GPT-4 level) to judge another model's output. This approach was systematically validated by Zheng et al. in their 2023 MT-Bench paper, achieving over 80% agreement with human evaluations.
MLflow provides a structured evaluation framework supporting three types of scorers:
- Built-in scorers: such as
correctness, which uses an LLM to judge whether an answer is correct - Guideline scorers: such as
guidelines, where rules are described in natural language (e.g., "responses must be in English")—this enables non-technical stakeholders to participate in defining quality standards, providing significant collaboration value in enterprise AI applications - Custom scorers: implement arbitrary evaluation logic using Python functions
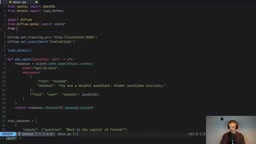
A typical custom scorer example—determining whether a response is sufficiently concise:
@score
def is_concise(outputs: str) -> bool:
    """Evaluate if response is concise (less than 5 words)"""
Related articles
 Tutorials
ChatGPT Plus Subscription Guide: Are GPT-5.5, image-2, and Codex Worth the Upgrade?
A detailed look at ChatGPT Plus features — GPT-5.5, image-2, and Codex — with a Plus vs Pro comparison and a complete step-by-step subscription guide for users outside the US.
 Tutorials
Harness AI Engineering in Practice: Using Claude Code to Master Enterprise-Level E-Commerce Development
Deep dive into Harness AI Engineering: master enterprise e-commerce development with Claude Code using the Rules, Skills, Wiki, and Changes framework.
 Tutorials
Cursor + Codex Dual-IDE Collaboration: A Practical Methodology for Open-Source Project Customization
A complete methodology for open-source project customization based on real-world experience, detailing the Cursor+Codex dual-IDE workflow, seven-stage process, MVP validation, and AI source code reading techniques.