Multiple Claude Models Hit Elevated Error Rates, Official Fix Completed Within Two Hours

Multiple Claude models failed simultaneously for about 1 hour 38 minutes, exposing the limits of redundancy strategies under shared failure domains.
This article reviews the incident where multiple Claude models experienced elevated request error rates between UTC 00:50 and 02:10. Affected models included Claude Mythos 5.1, Fable 5.1, and Opus 5, and it took approximately 1 hour 38 minutes from the first notification to "Resolved." The recovery process showed clear differences: the Fable and Mythos series recovered ahead of Opus 5, suggesting varying dependency levels on shared infrastructure. The article notes the failure likely originated in shared infrastructure or the request routing layer rather than any single model. The core takeaway for developers: multi-model redundancy does not equal high availability — shared failure domains can defeat fallback strategies, and cross-provider backup is the real redundancy. The precise impact window can also be used to review logs and compensate failed requests.
Incident Timeline: 80 Minutes from Detection to Resolution
According to the status page records, multiple Claude models experienced a concentrated spike in request error rates within a short period. The first notification was issued at UTC 00:57 with a status of "Investigating," affecting Claude Mythos 5.1, Claude Fable 5.1, and Claude Opus 5.
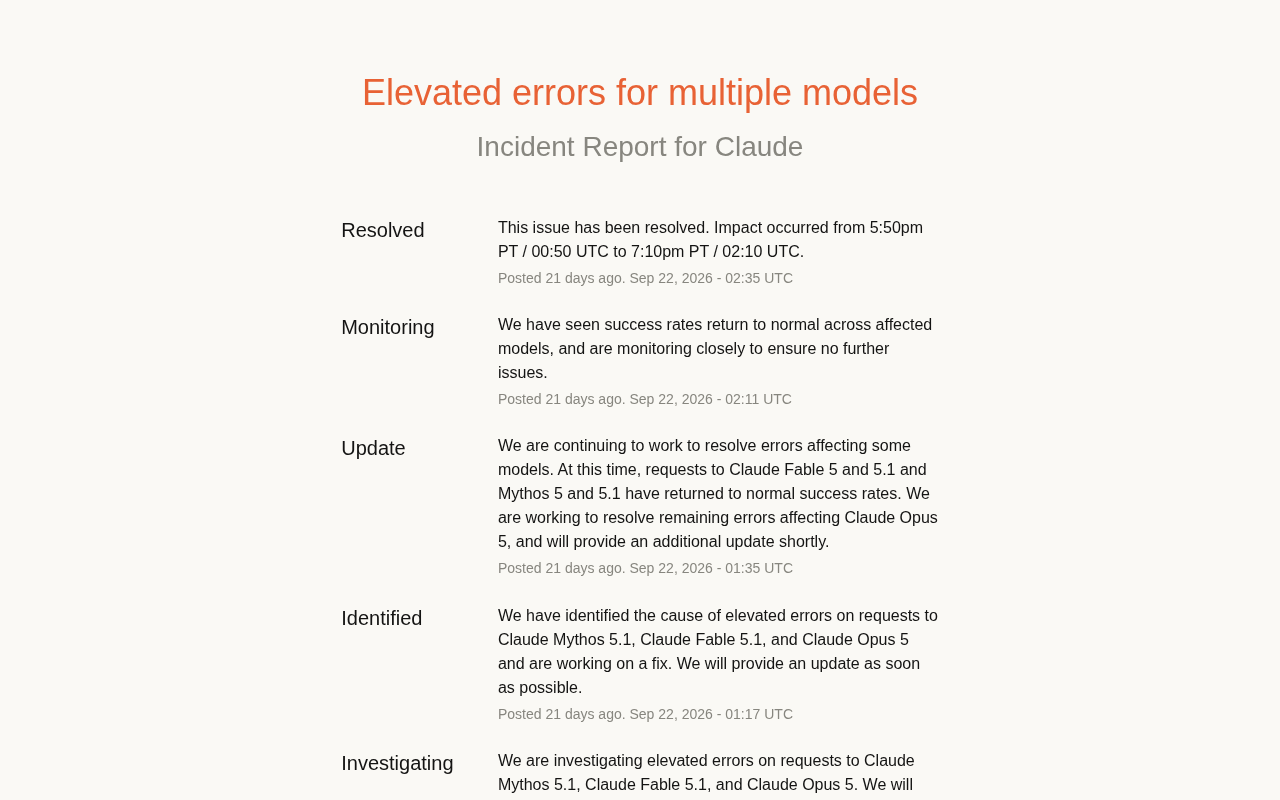
Twenty minutes later, the team updated the status to "Identified," confirming they had found the root cause of the elevated error rates and were working on a fix. By UTC 01:35, some models had recovered first — Claude Fable 5 and 5.1, along with Mythos 5 and 5.1, had returned to normal success rates, but Claude Opus 5 was still being processed. At UTC 02:11, the team announced that all affected models had returned to normal success rates and entered the monitoring phase. At UTC 02:35, the status was finally marked as "Resolved."
From the first report to full recovery, the entire process took approximately 1 hour and 38 minutes.
Error Rate in the context of API services typically refers to the proportion of requests that return error responses within a given time period. Unlike a complete outage, an elevated error rate means the service is still running, but some requests are failing — for example, returning HTTP 5xx errors, rate-limit responses, or timeouts. This kind of "Gray Failure" is harder to detect than a full outage, because monitoring dashboards don't turn completely red, yet the user experience is quietly degrading.
When providers publish status page notifications, they often distinguish between different severity levels such as "elevated latency," "elevated error rate," and "fully unavailable." For developers, the error rate metric is a key input for triggering their own alert thresholds — when the upstream error rate exceeds a preset percentage, they should automatically switch to a fallback or enable retry backoff. Understanding this metric helps in more accurately interpreting the wording of official incident notifications.
Differences in Affected Models and Recovery Pace
The number of models affected by this incident is noteworthy. Claude Mythos 5.1, Claude Fable 5.1, and Claude Opus 5 all showed elevated error rates simultaneously, suggesting the problem likely originated in shared infrastructure or the request routing layer rather than in any single model's inference logic.
The recovery process also showed a clear sequence. The Fable and Mythos series returned to normal success rates before UTC 01:35, while Opus 5, being the heavier flagship model, took longer to fix. This difference in recovery pace typically points to two possibilities: either Opus 5 depends on additional service components, or its traffic characteristics make errors more likely to accumulate. The team did not disclose specific technical details.
For developers using multi-model strategies, this kind of event provides a practical reminder: when multiple models become unavailable simultaneously, a simple model fallback strategy may fail. If the backup model and the primary model share the same failure domain, switching won't improve availability.
Failure Domain is a core concept when evaluating redundancy strategies. It refers to the scope within a system or set of components where, once a failure occurs, everything fails simultaneously. For example, if two models are deployed on the same load balancer, authentication service, or scheduling queue, those shared components constitute the same failure domain — they go down together.
When designing high-availability architectures, the key principle is to avoid placing primary and backup resources in the same failure domain. The "cross-availability-zone" and "cross-region" deployments commonly used by developers are essentially about increasing the isolation between failure domains. For products that depend on multiple AI APIs, determining whether a primary and backup model are truly redundant requires examining whether there's any shared link in their request paths: the same cloud provider, the same DNS, the same CDN, or even the same authentication gateway can all become entry points for Common Cause Failure. This simultaneous failure of multiple Claude models is a manifestation of common cause failure at the AI service layer.
The Informational Value of Status Page Notifications
The value of this notification lies not just in documenting an incident, but in demonstrating how AI service providers communicate when facing production issues: Investigating → Identified → Partial Recovery → Full Recovery → Monitoring → Resolved, with all six phases progressing in sequence within less than two hours.
Each update provided a clear list of affected models and the current recovery status, without vague wording. For teams building products on APIs, this level of granularity in notifications can be directly used to determine whether to trigger their own alerts or degradation logic.
The team mentioned that the actual impact window was from 5:50 PM to 7:10 PM Pacific Time (corresponding to UTC 00:50 to 02:10), roughly 7 minutes earlier than the first public notification. This indicates that internal monitoring systems triggered alerts before users perceived the problem, but there was still some delay between the alert and the public notification.
Status Page is a standard tool for SaaS and cloud service providers to publicly disclose service health, commonly seen on platforms like Statuspage and Instatus. Its core value is providing a single source of truth, preventing users from piecing together information about outages through social media or customer support channels.
A high-quality status page notification typically includes timestamps, affected components, current status level, and estimated recovery time. Status levels generally progress from "Operational" through "Investigating," "Identified," "Fixing," "Monitoring," to "Resolved." Developers can integrate status pages into automated systems — for example, through RSS or API polling — to automatically trigger internal alerts or degradation logic when the status changes. The six phases given by the team in this incident are a typical example of the standard status page lifecycle.
Practical Takeaways for Developers
Multi-model redundancy does not equal high availability. When a failure occurs at a shared layer, multiple models under the same provider may be affected simultaneously. Cross-provider backup solutions are needed for true redundancy.
Pay attention to the update frequency of the status page. Going from "Investigating" to "Identified" took only 20 minutes — this kind of response speed can serve as a reference metric for evaluating a provider's operational capabilities.
Use the official impact window provided. The notification specified UTC 00:50 to 02:10 as the actual impact period — developers can use this time window to review their own error logs and confirm whether there are uncaptured failed requests that need compensatory handling.
The speed of resolution in this incident was within an acceptable range, but it also exposed a fact: even for leading AI service providers, the risk of multiple models failing simultaneously still exists, and existing redundancy strategies may not cover this scenario.
Multi-Vendor Redundancy refers to establishing backup paths across different AI service providers, rather than relying on multiple models from the same provider. Its core assumption is that different providers' infrastructure, operations teams, and failure modes are independent of each other, making simultaneous failure less likely.
Implementing multi-vendor redundancy requires solving several engineering challenges: first, abstracting a unified model invocation interface to mask differences between each provider's API; second, establishing a consistent prompt and output format adaptation layer to ensure predictable behavior after switching; third, designing automatic failover logic triggered by health checks or error rates. The cost is increased expenses, greater maintenance complexity, and experience fluctuations caused by inconsistent output quality across different models. Whether it's worth it depends on the actual availability requirements of your business.
Related articles

Multi-Agent Voice Command Center in Practice: Deconstructing the VAPI + Supabase Architecture
Deconstructing the Load Bearing Empire multi-agent voice command center: VAPI voice pipeline, Supabase Edge Functions for Webhooks, 8 Postgres tables tracking agent state, and Vercel-managed frontend design.

Astro 7 Rewrote Every Page, So IndexNow Now Hashes What a Crawler Reads
NeuraGrowth documents how an Astro 7 upgrade caused 273 pages to be misjudged as updated, and switched IndexNow hashing from file bytes to crawler-readable content—text, links, title, meta, and JSON-LD only.

From Python to AI Agents: A Full-Stack Learning Path with 488 Lessons and 23 Projects
A Udemy course covering Python, machine learning, deep learning, LLMs, RAG, and AI Agents, with 488 lessons and 23 real-world projects. This article analyzes the logic of this full-stack AI learning path, who it suits, and self-study advice.