Neurolume: Interactive Visualization of PyTorch/Keras Model Training

Open-source tool Neurolume makes PyTorch/Keras model structure and training visible through interactive charts.
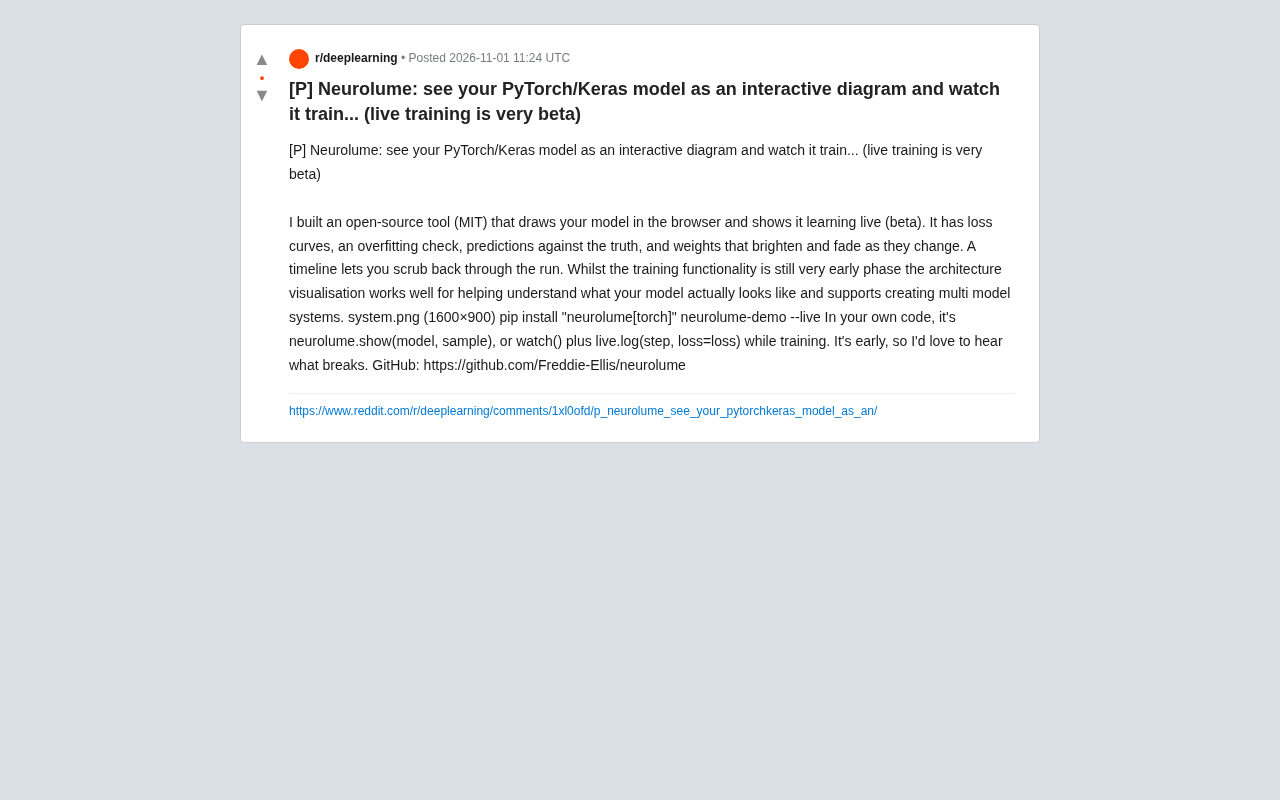
Neurolume is an MIT-licensed open-source visualization tool designed to break the black-box impression of deep learning models. It offers two levels of capability: architecture visualization is relatively mature—calling `show(model, sample)` generates an interactive computational graph in the browser, showing inter-layer connections and reflecting weight changes through color intensity; training monitoring is in early testing and supports loss curves, overfitting checks, prediction-vs-actual comparison, and timeline replay, streaming metrics via `watch()` with `live.log()`. The tool supports PyTorch and Keras and can be quickly installed via pip. It is positioned for model interpretability and local debugging, with stronger interactivity than TensorBoard, but its real-time training feature is not yet stable and is not suitable for production.
Deep learning models are often seen as black boxes, with their internal structure and training dynamics difficult to understand intuitively. A developer posted an open-source tool called Neurolume on Reddit, attempting to break through this barrier with interactive charts. It can draw the computational graphs of PyTorch or Keras models in the browser and display weight changes, loss curves, and prediction comparisons in real time during training, making the model's "learning" process visible.
Core Features: From Static Architecture to Dynamic Training
Neurolume's core capabilities are divided into two levels: architecture visualization and training monitoring. The former is already relatively mature, while the latter is still in early testing.
Architecture Visualization: See Every Layer of the Model Clearly
The developer states that although the training features are still very basic, architecture visualization already does a good job of helping users understand the model's actual structure, and supports creating multi-model systems. Users only need to call neurolume.show(model, sample) to generate an interactive chart in the browser. This chart not only shows the connections between layers but also reflects weight changes through color intensity—weights become brighter or darker as training progresses, providing intuitive visual feedback.
This visualization approach is especially useful for debugging complex networks. For example, when a model contains branching or recurrent structures, traditional text summaries struggle to present the whole picture, whereas interactive charts allow users to zoom, drag, and inspect each layer from macro to micro levels.
A computational graph is the underlying data structure through which deep learning frameworks express a model's forward and backward propagation. PyTorch uses a dynamic graph mechanism, where the computational graph is built on the fly during each forward pass, so node connections change with input shapes and data flow; Keras is closer to a static graph style, with the model structure largely determined at compile time. The reason Neurolume needs to support both frameworks is precisely that their graph-construction semantics differ: a visualization tool must first trace an actual forward pass to obtain a graph instance with concrete tensor shapes, which is also why show(model, sample) must be passed both the model and an input sample. Nodes in the graph typically correspond to an operator (such as convolution, matrix multiplication, or activation function), while edges represent the direction of tensor flow. Weight highlighting essentially maps parameter tensors to visual attributes of nodes or edges.
Training Monitoring: Observe the Learning Process in Real Time
Neurolume provides several training monitoring features, including loss curves, overfitting checks, comparison between predicted and actual values, and highlighting of weight changes. The developer streams training data to the browser via watch() and live.log(step, loss=loss), allowing users to see the loss curve update in real time. The tool also includes a built-in timeline feature that lets users replay the entire training process and drag the timeline to view the model state at any step.
However, the developer explicitly labels the "live training feature as very beta," suggesting possible stability or performance issues. Users who want to try it out can install it via pip install "neurolume[torch]" and run neurolume-demo --live to start a demo.
Overfitting refers to the phenomenon where the model's loss continues to decrease on the training set while the validation loss begins to rise. The standard practice for monitoring overfitting is to record both training and validation loss curves simultaneously and observe whether a "scissor gap" appears between them. Neurolume's overfitting check usually gives hints based on this difference trend, but it relies on the user actively passing in validation metrics; otherwise, it can only display the training-side curve and cannot judge generalization performance. In addition, the loss curve itself needs to be interpreted together with hyperparameters such as learning rate and batch size—judging by curve shape alone can easily lead to misdiagnosis. For example, when the learning rate is too large, the loss will oscillate violently, which is not the same as overfitting.
Usage and Installation
Neurolume is open source under the MIT license, with code hosted on GitHub. The installation command is pip install "neurolume[torch]", and it supports both PyTorch and Keras. In your own code, in addition to the show() method, you can also use watch() together with live.log() to record training metrics. The developer encourages users to report issues, especially those that cause crashes or anomalies.
Positioning and Limitations
Neurolume targets model interpretability and debugging scenarios. Compared with traditional tools like TensorBoard, it emphasizes interactivity and visual intuition, attempting to let developers "see" the model learning. However, it should be noted that the real-time training feature is not yet complete and may not be suitable for production environments. In addition, the tool currently mainly targets PyTorch and Keras users, and support for other frameworks has not been mentioned.
For researchers and engineers, Neurolume offers a new perspective for observation. Whether it can become part of the standard toolchain depends on future stability and feature expansion. But at least it brings us one step closer to opening up the deep learning black box.
TensorBoard is a widely used visualization tool in the TensorFlow ecosystem. It records scalars, histograms, computational graphs, and embeddings through log files and presents them in a web panel. It usually requires explicitly calling SummaryWriter to write event files and then starting the service to view them. Neurolume's difference lies in its emphasis on "interactive, immediate feedback": it renders model structures directly as embedded charts in the browser, supports zooming, dragging, and weight brightness changes, and is closer to a debugger than a log viewer. The two are not completely substitutes for each other—TensorBoard is more mature in distributed training, hyperparameter comparison, and large-scale experiment management, while Neurolume is currently better suited for quickly building intuition about model structure during local single-machine debugging.
Future Outlook
The developer says they are actively collecting feedback and plan to improve the training features. With community participation, Neurolume has the potential to secure a place in the field of model interpretability. If you are interested in visualizing model training, you might clone the project from GitHub and experience this "what you see is what you get" debugging approach.
Related articles

VERS: Editing Activation Explanations to Halve Reasoning Model Tokens
VERS guides reasoning models by editing activation explanations, cutting 45.8% of tokens on GSM8K with only a 0.82 pp accuracy drop and transferring to larger models, but losing accuracy on competition problems.

Finding Errors Is Not Enough: Selective Model Escalation for Entity-Targeted Sentiment Analysis
This study explores selective model escalation for entity-targeted sentiment analysis, comparing data collection ordering, uncertainty-driven re-examination, and model routing—finding that minority-class priority only helps at very small data volumes, the oracle upper bound far exceeds actual gains, and escalation must be tailored to each dataset.
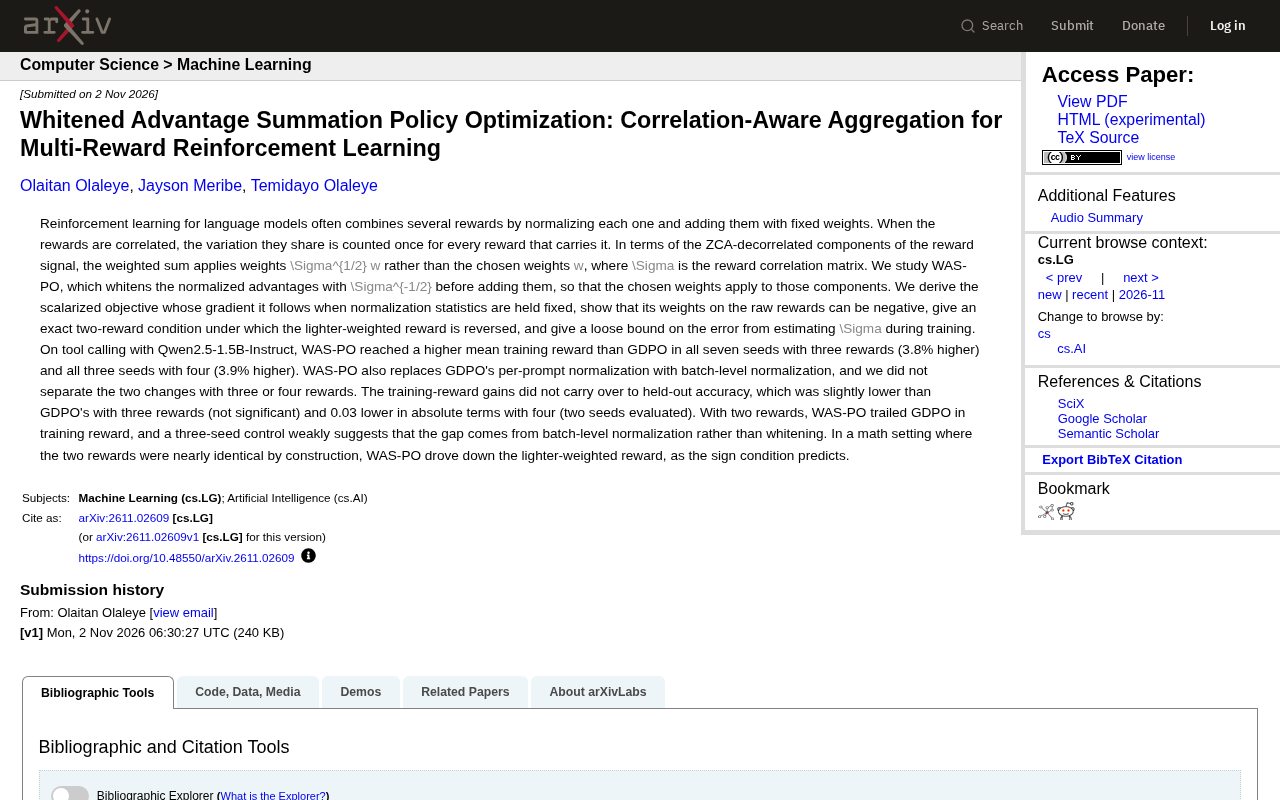
WAS-PO: Using Whitened Advantages to Solve the Correlation Trap in Multi-Reward Reinforcement Learning
WAS-PO paper proposes whitening advantages to correct correlation bias in multi-reward RL: when rewards are correlated, naive weighted summation effectively applies Σ^{1/2}w instead of w. Experiments show training reward improves steadily, but held-out accuracy does not improve in sync, and under two rewards it actually falls behind.