NVIDIA Nsight Python Tutorial: Profiling GPU Kernels Directly from Python

The Nsight Python open-source interface lets developers profile GPU kernels directly in Python for programmable performance measurement.
NVIDIA Nsight Python is an open-source interface that allows developers to profile GPU kernels directly within Python code without switching to graphical tools like Nsight Compute. It supports collecting hardware metrics (such as SM occupancy and memory throughput), evaluating cache and clock controls, and measuring kernel fusion effects. It is well suited for embedding into test scripts for frameworks like PyTorch and JAX to enable batch, reproducible performance screening. Nsight Python and Nsight Compute are complementary: the former focuses on rapid measurement, the latter provides deep source-level analysis. Be mindful of the runtime overhead of kernel-level collection and cross-validate results in a non-profiling state.
Why Profile GPUs from Python
GPU kernel performance issues often hide in hardware counters, not in Python code timing statistics. The traditional approach is to rerun the program with graphical tools like Nsight Systems or Nsight Compute, forcing developers to switch back and forth between Python and CUDA and lengthening the debugging chain. NVIDIA Nsight Python changes this: according to MarkTechPost, it is an open-source interface that allows developers to profile GPU kernels directly within Python code, read hardware metrics, evaluate cache and clock controls, and measure kernel fusion effects.
This positioning is worth noting. It is not intended to replace Nsight Compute's deep analysis capabilities, but rather to move the "measurement" step back into the language environment developers are most familiar with, making performance profiling part of the Python workflow. For those writing code with PyTorch, JAX, or CuPy, this means training, inserting profiling points, and reading results can all be done in the same script.
Core Capabilities Breakdown
Hardware Metrics and Kernel-Level Observation
The most direct value of Nsight Python is exposing GPU hardware counters to Python. Developers can collect metrics for specific kernels without coarse-grained sampling of the entire process. The original article mentions support for "analyze hardware metrics," meaning low-level data such as SM occupancy, memory throughput, and instruction issue efficiency can be obtained programmatically.
This is critical for tuning. Kernel timing alone only tells you "it's slow"; hardware metrics tell you "why it's slow"—whether it's a memory access bottleneck, idle compute units, or insufficient occupancy. Returning this data as Python objects means it can be fed directly into pandas or visualization libraries for batch comparison.
SM Occupancy is a key metric for measuring GPU parallel efficiency, referring to the ratio of active warps per streaming multiprocessor (SM) to the maximum number of warps supported by the hardware. Insufficient occupancy usually means the kernel lacks enough thread-level parallelism to fully hide memory latency, causing compute units to sit idle. In Nsight Python, developers can obtain actual occupancy data through hardware counters and, combined with factors such as kernel register usage and shared memory configuration, determine whether resource constraints are reducing active warps.
Memory Throughput reflects the actual amount of data transferred by GPU memory per unit time, typically measured in GB/s. It distinguishes theoretical peak bandwidth from actual effective bandwidth, helping developers identify whether a kernel is limited by global memory access. When memory throughput approaches the hardware limit while compute utilization is low, the kernel is likely in a memory-bound state.
Instruction Issue Efficiency measures the proportion of instructions successfully issued by an SM per clock cycle. Low issue efficiency may stem from instruction dependencies, branch divergence, or resource conflicts. By collecting these metrics through Nsight Python, developers can pinpoint specific kernel code sections and then optimize instruction scheduling or reduce divergence.
Cache and Clock Controls
The original article also mentions "evaluate cache and clock controls." Cache behavior (L1/L2 hit rates) and clock frequency (whether throttling occurs, whether boost is active) are two common variables that explain performance fluctuations. Incorporating them into the Python interface means controlled-variable experiments can be conducted within the same experimental framework: fix the clock to observe cache effects, or fix the cache configuration to observe frequency changes.
For those running benchmarks, this eliminates a lot of manual work. Previously such measurements often relied on command-line parameters and external configuration files; now experimental conditions can be expressed as code in Python, facilitating version control.
L1/L2 Cache Hit Rate is an important factor affecting GPU kernel performance. L1 cache is a high-speed cache private to each SM, used to store frequently accessed data and instructions; L2 cache is shared by all SMs, with larger capacity but higher latency. A low hit rate means more data must be read from global memory, increasing memory access latency. Nsight Python allows developers to measure kernel performance under different cache configurations—for example, by adjusting cache partitioning or using cache warm-up strategies—to observe how hit rate changes affect overall throughput.
Clock Frequency Control involves the GPU's dynamic frequency adjustment mechanism. Modern GPUs typically support Boost Clock, dynamically raising frequency based on power and temperature. However, under sustained high load, the GPU may throttle due to power or thermal limits, causing performance fluctuations. Nsight Python's clock control feature enables developers to lock GPU clock frequency, thereby eliminating frequency variation as a source of interference in performance measurements and ensuring consistency of experimental conditions. This is particularly important for benchmarks that require precise comparison of different kernel implementations.
Kernel Fusion Measurement
"measure kernel fusion" is an easily overlooked but very practical capability. Kernel fusion is a common optimization technique used by deep learning compilers and inference engines, merging multiple small operators into one large kernel to reduce launch overhead and memory round-trips. But whether fusion actually brings benefits requires empirical measurement.
Nsight Python lets developers perform comparative measurements of kernels before and after fusion, rather than relying on experience-based judgment. This is especially valuable for teams using TorchInductor, XLA, or TVM—whether the compiler-generated fusion strategy is effective can be backed by data.
Practical Advice and Limitations
From a workflow perspective, Nsight Python is better suited for embedding into existing test or tuning scripts rather than replacing graphical analysis. Its advantages are programmability, batchability, and reproducibility; its disadvantage is the lack of Nsight Compute's interactive source-level correlation view. A reasonable approach is: use Nsight Python for rapid screening and regression comparison, then use graphical tools to dig deeper once anomalous kernels are identified.
It should be noted that the original material only provides a functional overview, without installation instructions, API examples, or performance overhead data. Before actual use, consult the official documentation to confirm supported GPU architectures and Python versions, and be aware of the runtime perturbation introduced by profiling itself—kernel-level collection typically incurs additional overhead, and measurement results need to be cross-validated in a non-profiling state.
Another consideration is team collaboration. Writing profiling logic into Python code means performance experiments can be committed, reviewed, and reproduced alongside the code, which is far more reliable than verbally describing "I ran Nsight on some machine." For inference services or training frameworks that require long-term maintenance, this reproducibility is itself a benefit.
FAQ
What is the relationship between Nsight Python and Nsight Compute? The former is a programmable interface on the Python side, focused on fast, batch kernel measurement; the latter is a graphical deep analysis tool, focused on source-level correlation and detailed metric interpretation. They are complementary rather than substitutes.
Is it only for CUDA? The original material does not mention support for other acceleration backends; refer to the official documentation.
Does profiling affect performance data? Yes. Kernel-level collection incurs runtime overhead; it is recommended to perform baseline comparisons with profiling disabled to eliminate measurement perturbation.
Related articles
Microsoft Fabric Database Agent in Action: From Reactive Firefighting to Intelligent Detective
A deep dive into the Microsoft Fabric Database Agent: how to enable it, supported monitoring scenarios, a blocking-issue demo, and the roadmap from reactive to autonomous operations.

Zendesk Uses ChatGPT Enterprise to Build a Sales Agent with 1,000 Daily Active Users
Zendesk opened ChatGPT Enterprise to all employees, who built about 600 apps themselves, including a sales expansion agent with about 1,000 daily active users. This article analyzes how it turns internal data into sales opportunities and its "don't wait" implementation strategy.
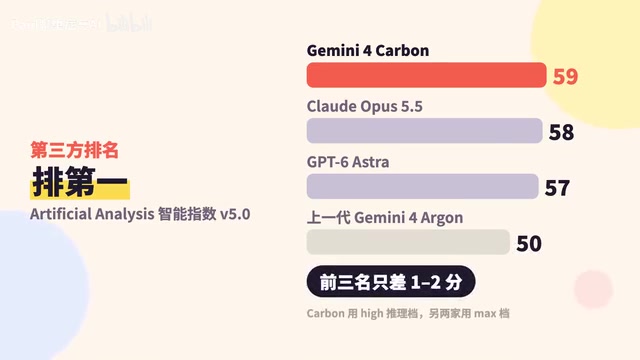
Google Releases Gemini 4 Carbon: Its Strongest Model Yet, Debuting with a Cybersecurity Focus
Google releases Gemini 4 Carbon, calling it its strongest model, with a cybersecurity focus. It tops the third-party composite ranking at 59 points but leads by only one or two. This article analyzes its security test results, staged rollout, token pricing, and the divergence between self-reported and third-party tests on hallucinations.