OpenAI Agents SDK Tracing Guide: Zero-Configuration Agent Observability

OpenAI Agents SDK's built-in tracing enables full-chain observability for AI Agents
This article covers the importance of AI Agent observability and how to use the OpenAI Agents SDK's built-in tracing system. Since Agent behavior is probabilistic, traditional monitoring falls short, making dedicated tracing systems essential. The SDK supports zero-configuration automatic tracing that records LLM reasoning, tool calls, latency, and more. It also provides a trace context manager for custom workflow names, group IDs, and metadata, enabling granular monitoring and filtering, with full-chain tracing support for tool calls like Web Search.
Why AI Agents Need Observability
When building AI Agent-based applications, a core challenge is: you can hardly know what's actually happening inside the Agent. Which tools did it call? How long did each step take? What were the inputs and outputs? These questions are critical for debugging and optimization.
Observability is a concept originating from control theory. In software engineering, it refers to the ability to infer internal states from a system's external outputs. In traditional microservice architectures, observability is typically built on three pillars: Logs, Metrics, and Traces. The emergence of AI Agents significantly escalates this challenge: Agents are not just deterministic code—they involve LLM reasoning, dynamic tool selection, and multi-step planning. Their behavior is inherently probabilistic, and traditional monitoring methods struggle to capture "why the model made this decision." Therefore, tracing systems designed specifically for Agents have become indispensable infrastructure.
The OpenAI Agents SDK comes with a powerful built-in Tracing system that requires almost no additional configuration. Simply pass in your API Key and enable tracing to get complete visualization of Agent execution. This article covers how to use this tracing system in detail, including basic configuration, custom tracing, and tool call tracing.
What the OpenAI Agents SDK Tracing System Reveals
In the OpenAI Dashboard, the tracing system automatically records every step of an Agent's execution. Using a JFK document assistant RAG pipeline as an example, the tracing panel clearly shows:
- The LLM text generation process: including the model's decision to call a specific tool (e.g., the JFK file search tool)
- Tool call return results: what was searched and which documents were returned
- Time taken for each step: initial tool call ~1 second, response time ~100 milliseconds, final response taking longer due to processing a large volume of documents
- Complete inputs and outputs: including the document content passed in and the final generated answer
RAG Pipeline Background: RAG (Retrieval-Augmented Generation) is the current mainstream knowledge enhancement approach. Its core idea is: before the LLM generates an answer, first retrieve relevant document fragments from an external knowledge base, then feed the retrieval results along with the user's question into the model. This solves the LLM's knowledge cutoff date and hallucination issues. The JFK document assistant is a typical RAG scenario—requiring precise retrieval from a large collection of declassified archives. The tracing system is particularly important in such scenarios because retrieval quality directly determines the accuracy of the final answer, and the tracing panel clearly presents the inputs and outputs of each retrieval, helping developers quickly identify whether there are issues in the retrieval step.
This information is extremely valuable for understanding Agent behavior, identifying performance bottlenecks, and debugging issues.
Basic Configuration: Enabling Agent Tracing
Permission Settings
There's a key point to note before using the tracing feature: if you belong to an OpenAI organization, tracing information is only visible to organization owners by default.
OpenAI's Organization permission system is similar to enterprise SaaS multi-tenant models. An organization can have multiple Projects and multiple members, with member roles divided into Owner and Member. Since tracing data involves sensitive information such as user inputs and model outputs, it's only visible to Owners by default—this is a data security and compliance consideration. In enterprise environments, this runtime data may contain business-sensitive content and requires careful access permission configuration aligned with data governance policies.
Regular engineers need to configure the following:
- Click the settings icon in the top-right corner of the Dashboard
- Navigate to "Data Controls"
- Find the log visibility settings, including Response Logs and Stored Traces
- Set "Track Completions and Traces" to visible to everyone, visible to selected projects, or visible only to yourself
- Click save
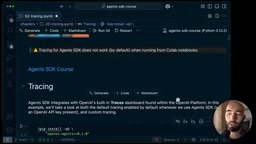
After completing the permission configuration, go to the Traces page in the Dashboard to view all tracing records.
Zero-Configuration Automatic Tracing
The most pleasant surprise is that basic tracing requires almost no additional code. Simply create an Agent and run it normally, and tracing information is collected automatically:
from agents import Agent, Runner

agent = Agent(
    name="tracing prompt agent",
    instructions="speak like a pirate",
    model="gpt-4.1-nano"
)

result = await Runner.run(agent, "write a one sentence poem")

After running, check the latest tracing record in the Dashboard. You can see the Agent name, token usage (e.g., 43 tokens), model version used, instructions, user input, and assistant output—all this information is collected automatically without writing any tracing code.
Note: As of now, the tracing feature does not work properly in Google Colab and needs to be run in a local environment.
Custom Tracing: Achieving More Granular Agent Monitoring
Using the trace Context Manager
While default tracing is already powerful, sometimes we need finer control. The Agents SDK provides a trace function as a context manager, allowing custom tracing parameters:
from agents import trace

with trace(
    workflow_name="prompt agent workflow",
    group_id="agents SDK course tracing"
):
    result = await Runner.run(agent, "write a one sentence poem")
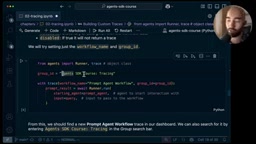
There are two key parameters here:
- workflow_name: A custom workflow name that replaces the default "agent workflow," making it easier to quickly identify in the Dashboard
- group_id: A group identifier that groups related tracing records together, supporting group-based filtering in the Dashboard
The group_id design draws from the Trace Context standards in the distributed tracing field (such as W3C TraceContext). In complex systems, a single business request may span multiple services and multiple LLM calls, requiring a correlation identifier to link scattered trace fragments into a complete chain. group_id plays a similar role in the Agents SDK—it's not a unique ID for a single run, but a logical grouping label that allows developers to group all traces from the same feature module, test batch, or user session together. In the Dashboard, you can search by group_id to filter all traces for a specific group, or filter by workflow_name—this is very practical when managing large volumes of tracing data.
Adding Metadata
Beyond basic naming and grouping, you can also add custom metadata to traces for more flexible filtering and analysis:
with trace(
    workflow_name="web search agent",
    group_id="agents SDK course tracing",
    metadata={"tools": "web_search_tool"}
):
    result = await Runner.run(agent, "world headlines")
In the Dashboard, you can filter based on metadata—for example, filtering all traces that used web_search_tool. You can add any key-value pairs to metadata, such as environment identifiers (env: production), version numbers (version: v2.1), user IDs, etc., to meet various operational and analytical needs. Well-structured metadata design makes the tracing system not just a debugging tool, but also supports more complex data analysis scenarios like A/B test analysis and user behavior research.
Tool Call Tracing: Monitoring Agent External Interactions
The tracing system's support for tool calls is particularly excellent. Using OpenAI's built-in Web Search tool as an example:
from agents import WebSearchTool

agent = Agent(
    name="tracing tool agent",
    instructions="You are a website agent that searches the web for information on user queries",
    model="gpt-4.1-mini",
    tools=[WebSearchTool()]
)
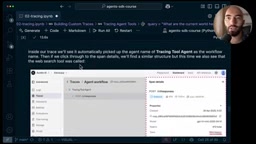
OpenAI's tool calling relies on the underlying Function Calling mechanism, which was introduced during the GPT-4 era and has continued to evolve. When the model determines it needs external information during answer generation, it outputs a structured JSON call request rather than directly generating text. The host program executes the actual tool logic and returns the results to the model. WebSearchTool is a high-level wrapper around this mechanism—the tracing system captures the entire chain from "model decision → issuing call request → executing search → returning results → model integration" as a complete observable link.
Related articles
 Tutorials
ChatGPT Plus Subscription Guide: Are GPT-5.5, image-2, and Codex Worth the Upgrade?
A detailed look at ChatGPT Plus features — GPT-5.5, image-2, and Codex — with a Plus vs Pro comparison and a complete step-by-step subscription guide for users outside the US.
 Tutorials
Harness AI Engineering in Practice: Using Claude Code to Master Enterprise-Level E-Commerce Development
Deep dive into Harness AI Engineering: master enterprise e-commerce development with Claude Code using the Rules, Skills, Wiki, and Changes framework.
 Tutorials
Cursor + Codex Dual-IDE Collaboration: A Practical Methodology for Open-Source Project Customization
A complete methodology for open-source project customization based on real-world experience, detailing the Cursor+Codex dual-IDE workflow, seven-stage process, MVP validation, and AI source code reading techniques.