Postmortem and Lessons from the Claude Platform Usage Data Loading Incident

An Anthropic usage page outage lasted about 1h40m, Messages API unaffected, exposing billing data availability risks.
High-frequency errors occurred on Anthropic's platform.claude.com usage page and Admin API usage report endpoint, lasting about 1 hour and 40 minutes. The official status page made clear that Messages API requests were unaffected, with the failure limited to the usage data reading chain. The analysis notes that usage queries rely on independent dependencies such as logging pipelines, statistics storage, and reporting query layers, completely different from the inference path, and can therefore be isolated. For developers, the incident suggests not relying solely on platform dashboards for cost monitoring, and instead recording token counts on the application side for cross-checking, while designing retry and cache degradation logic for Admin API calls. The availability of usage and billing data is shifting from a “nice to have” to an infrastructure metric as important as inference availability.
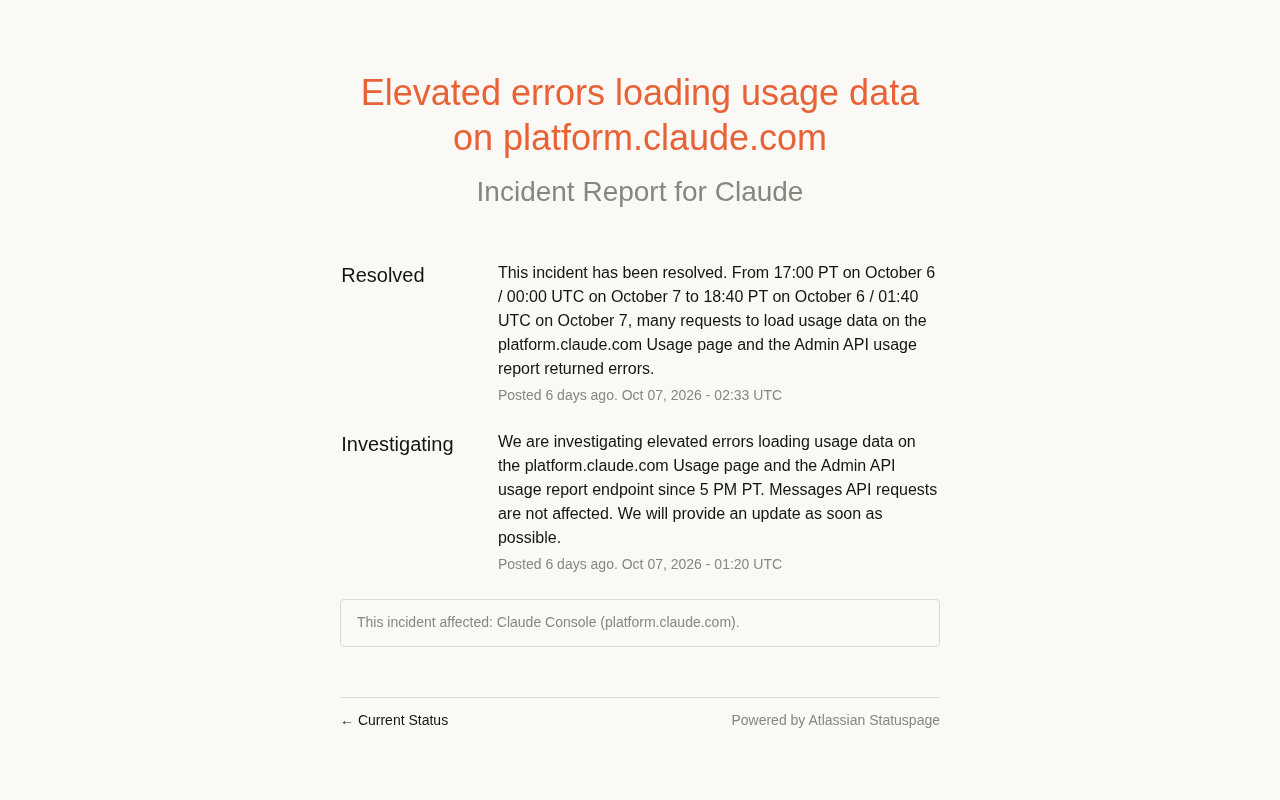
When developers open Anthropic's platform.claude.com usage page and find that their team's token consumption and call statistics won't load at all, the anxiety is no less than that of an actual production outage. An incident documented on Anthropic's official status page exposed a weak link in the observability layer of modern AI platforms.
Full Incident Timeline
Based on the two updates on Anthropic's status page, the timeline of this outage is quite clear:
- Detection and investigation phase: The team published a status update at 01:20 UTC (5 PM Pacific Time), confirming “high-frequency errors” on the Usage page of
platform.claude.comand the usage report endpoint of the Admin API. - Scope of impact: The status page specifically emphasized that Messages API requests were not affected—in other words, model inference itself continued running normally; what broke was the “view the ledger” chain.
- Resolution and postmortem: A resolved notice was published at 02:33 UTC, with the outage window spanning from 17:00 to 18:40 Pacific Time on October 6, roughly 1 hour and 40 minutes.
This state of “the model is in use, but the data is invisible” actually has a significant impact on teams that rely on usage data for cost accounting and quota management.
The correspondence between UTC and Pacific Time: The article mentions that the status page update times used both UTC and Pacific Time (PT). UTC (Coordinated Universal Time) is the global time standard, while Pacific Time was on daylight saving time (PDT, UTC-7) in October. Therefore, 01:20 UTC corresponds to 18:20 (6:20 PM) Pacific Time the previous day, not 5 PM as stated in the article—the latter is closer to 00:00 UTC. Understanding this time zone conversion helps accurately reconstruct the true start and end of the outage window and avoids ambiguity in cross-team communication about “how long the outage lasted.” In multinational SRE scenarios, recording incident timelines uniformly in UTC is an industry convention.
The difference between the Admin API and the Messages API: The Messages API is the interface for model inference, through which developers send conversation requests and receive completion results; the Admin API is the interface for organization management, used to query operational data such as members, keys, and usage reports. In Anthropic's architecture, the two belong to different service boundaries, with independent rate limiting, authentication, and backend dependencies. Therefore, a failure of the Admin API's usage report endpoint does not necessarily affect inference requests—which also explains why the status page was able to clearly delineate the scope of impact.
Why “viewing usage” can break
The Usage page and the Admin API's usage report are essentially a read-heavy, write-light but long-chain data aggregation system. It must aggregate cross-region call logs, deduplicate them, summarize them by organization/project dimension, and then expose them through the frontend or API.
Compared with the “write path” of the Messages API, usage queries rely on completely different service dependencies. The former only needs the inference cluster and gateway to be healthy to work, while the latter additionally depends on the logging pipeline, statistics storage, and reporting query layer. This explains why the status page could clearly state that “the Messages API is not affected”—they are not on the same critical path at all.
For developers, this highlights an often overlooked risk: your monitoring dashboard may be the most fragile link. When usage data is unavailable, teams can neither determine whether current consumption is abnormal nor trigger budget alerts in time.
Read-heavy, write-light and data aggregation systems: “Read-heavy, write-light” describes the access pattern of this type of system—call log writes are continuous and stable (each API call produces one record), while usage queries are concentrated in scenarios such as report refreshes, billing reconciliation, and alert polling. Read request volume may be far higher than write volume, but the requirements for latency and consistency are also higher. More critically, usage queries need to perform aggregation, deduplication, and dimensional summarization over massive logs, which typically relies on columnar storage or OLAP engines, completely different from the low-latency key-value stores used by inference services.
Observability: Observability refers to the ability to infer the internal state of a system through three types of data: logs, metrics, and traces. In the context of AI platforms, it includes not only the platform's own operational monitoring but also the dashboards exposed to users, such as usage, quotas, and error rates. When the observability chain itself fails, users fall into a “black box” state—they neither know whether the system is normal nor can verify their own judgment. This is precisely the core risk of this incident: inference was normal but the ledger was invisible, equivalent to losing control over cost and quota.
What developers should take away from this
The incident itself has been resolved, but several practices are worth retaining:
- Do not rely solely on platform dashboards for cost monitoring. You can record token counts on the application side and cross-check them against platform data, so that when the dashboard is occasionally unavailable you are not completely in the dark.
- Design degradation logic for Admin API calls. If your finance or alerting system periodically pulls usage reports, it is advisable to add retries and cache fallbacks for returned errors, rather than letting the entire process break directly.
- Follow the status page, but do not only watch the status page. In this incident, Anthropic updated investigation progress and resolution results in a timely manner, and this transparency deserves recognition. But for teams, what matters more is integrating this kind of information into their own alerting channels.
A mirror for platform reliability
Anthropic's handling of this incident was relatively standard: first confirm the problem, clarify the impact boundary (the Messages API was not affected), provide the time window, and then announce resolution. This kind of communication that clearly explains the “scope of impact” is more valuable than simply saying “we are fixing it.”
From a broader perspective, as more and more enterprises run critical business on large model APIs, the availability of usage and billing data is shifting from a “nice to have” to an infrastructure metric as important as inference availability. A brief usage page outage may not affect your product functionality, but it directly affects your control over costs. For both platform providers and developers, this is a reminder worth remembering.
One-line Summary
An Anthropic usage page outage lasted about 1 hour and 40 minutes, with the Messages API unaffected, exposing the risk to billing data availability.
Paragraph Summary
High-frequency errors occurred on Anthropic's platform.claude.com usage page and the Admin API usage report endpoint, lasting about 1 hour and 40 minutes. The official status page clearly stated that Messages API requests were unaffected and the failure was limited to the usage data reading chain. The article's analysis points out that usage queries rely on independent dependencies such as the logging pipeline, statistics storage, and reporting query layer, completely different from the inference path, and can therefore be isolated. For developers, the incident suggests that they should not rely solely on platform dashboards for cost monitoring, and should instead record token counts on the application side for cross-checking, while designing retry and cache degradation logic for Admin API calls. The availability of usage and billing data is shifting from a “nice to have” to an infrastructure metric as important as inference availability.
Related articles

Gemini 4 Argon Hands-On: AI Builds Board Games, Constructs Temples, and Trains Robots Autonomously
Gemini 4 Argon hands-on roundup: AI autonomously builds a desk racetrack and temple in Blender, writes a ray tracing engine, trains a humanoid robot to sink 7 shots, plus API pricing and developer access.

The Magic Octagonal Coin: Why Only 9% of People Can Predict Its Flip?
Only 9% of people can correctly predict the Magic Octagon coin flip. This article explains its spatial rotation mechanism, common cognitive pitfalls, and a new hypothesis based on Relevance Theory, exploring the limits of human spatial reasoning.

Sam Altman: AI Is Entering the Era of Scientific Discovery — Math Breakthroughs Will Replicate in Biology and Energy
Sam Altman says AI is entering the era of scientific discovery — math breakthroughs will replicate in biology, materials science, and energy to help develop new drugs and energy sources.