Sentry Deep Dive: The Developer-First Error Tracking and Performance Monitoring Platform

Sentry is a developer-first open-source platform for real-time error tracking and performance monitoring with self-hosting support.
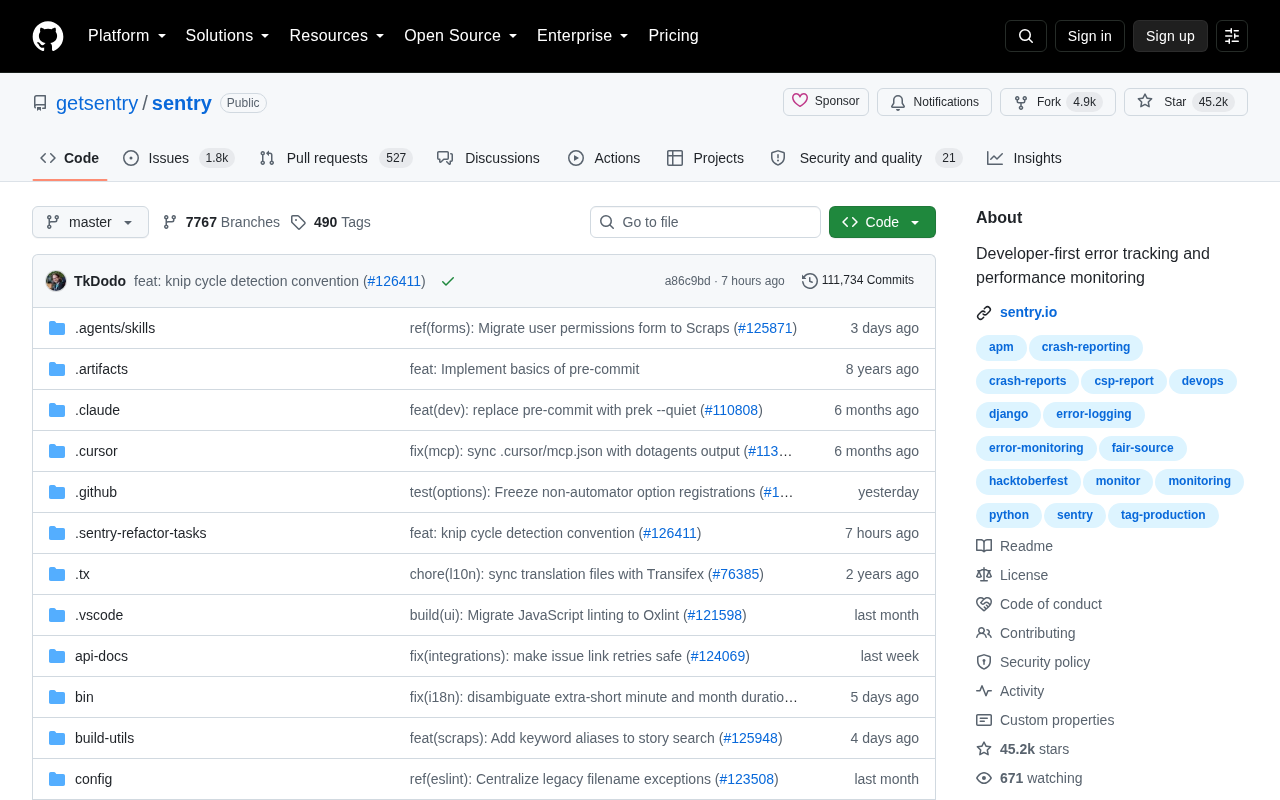
Sentry is a "developer-first" application monitoring platform that tackles error tracking and performance monitoring in production environments. It captures exceptions in real time with full context — stack traces, code-line attribution, and fingerprint-based deduplication — so teams can prioritize fixes by user impact. On the performance side, it uses distributed tracing to map request lifecycles and surface bottlenecks. Written primarily in Python, Sentry offers SDKs for all major languages and can be used as a SaaS service or self-hosted via Docker Compose for data compliance. With over 45,000 GitHub Stars and an active community, it is one of the most widely adopted open-source observability solutions available.
Sentry Deep Dive: The Developer-First Error Tracking and Performance Monitoring Platform
In modern software development, shipping an application is just the beginning — the real challenge lies in detecting and diagnosing production anomalies quickly. Sentry (getsentry/sentry) is an error tracking and performance monitoring tool built around a "Developer-first" philosophy. It has accumulated over 45,000 Stars on GitHub, with 214 new Stars added per day, making it one of the most prominent projects in the open-source observability space.
What Is Sentry
At its core, Sentry is an application monitoring platform focused on solving two fundamental problems: Error Tracking and Performance Monitoring. When your application throws an exception in production, Sentry captures it in real time and provides full context — including stack traces, request parameters, user interaction paths, and runtime environment details — helping developers pinpoint the root cause without relying on user-submitted bug reports or sifting through scattered log files.
The project is primarily written in Python and has 4,898 Forks. Active community contributions and continuous updates have made it a compelling choice for enterprise-grade monitoring. It can be used as a SaaS service or self-hosted on your own infrastructure, balancing convenience with full control over your data.
What "Developer-First" Actually Means
Sentry's most defining characteristic is its "Developer-first" approach — not just a tagline, but a philosophy embedded throughout the product design. Traditional monitoring tools are typically oriented toward operations teams and focus on server metrics and system health. Sentry shifts the perspective back to the people writing the code.
When an error occurs, Sentry links the exception directly to the specific line of code, the commit, and even the developer who introduced the issue. This fine-grained attribution dramatically shortens the path from "detecting a problem" to "fixing a problem." Instead of hunting through mountains of logs, developers can immediately see "which line of code, under what conditions, affected how many users."
The Core Value of Error Tracking
Error tracking is Sentry's foundation. It automatically aggregates and deduplicates similar exceptions, preventing a single bug from generating thousands of redundant alerts. It also tracks the frequency trend of each error, the number of affected users, and device distribution — giving teams the data they need to prioritize issues by impact rather than gut feeling.
Sentry's exception aggregation mechanism is based on a "Fingerprint" algorithm: the system hashes characteristics of each exception — stack frames, exception type, error message — and groups events with matching fingerprints into a single "Issue." This solves a core pain point of traditional log monitoring: a single production incident can trigger tens of thousands of log entries within minutes, but in Sentry it surfaces as one entry showing "occurred N times, affected M users." Beyond automatic fingerprinting, teams can define custom fingerprint rules or manually merge Issues to handle edge cases — such as errors that differ only in dynamic parameters but represent the same underlying bug.
Sentry's Source Maps support is particularly valuable for frontend developers. JavaScript in production is typically minified and obfuscated, but Source Maps translate compressed error locations back into readable original source line numbers, bringing frontend exception diagnosis up to par with backend debugging.
Extending into Performance Monitoring
As observability needs have evolved, Sentry has expanded beyond pure error tracking into performance monitoring. It can trace the complete lifecycle of a request, identifying slow queries, API bottlenecks, and frontend rendering delays. This means developers can understand not just "what crashed" but also "what slowed down" — giving them a holistic view of application quality.
Sentry's performance monitoring is built on Distributed Tracing, with "Transaction" and "Span" as its core data units. A Transaction represents a complete operation (such as handling one HTTP request), composed internally of multiple Spans — each corresponding to a specific timed operation like a database query, external API call, or cache read/write. This hierarchical structure is visualized as a waterfall chart, making it easy to identify which step is dragging down overall response time.
In microservice architectures, Sentry propagates Trace IDs through request headers to stitch together call chains spanning multiple services into a single complete trace record. Developers no longer need to manually correlate logs across systems to pinpoint cross-service performance bottlenecks. This capability is compatible with the OpenTelemetry standard, making it straightforward to integrate with existing observability infrastructure.
Why It Has 45,000+ Stars
Several key factors explain Sentry's sustained popularity.
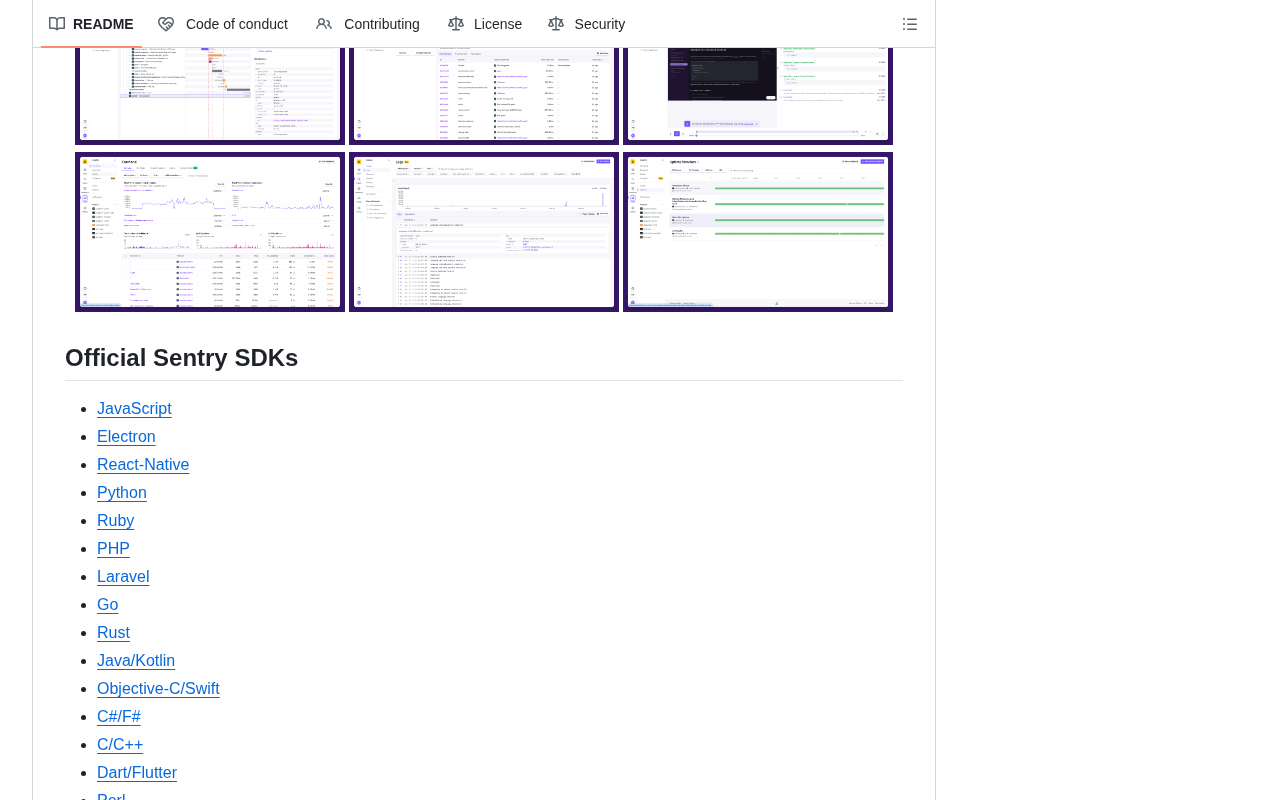
Broad multi-language ecosystem support is the first. Sentry provides SDKs covering all major programming languages and frameworks — JavaScript, Python, Java, Go, and mobile platforms including iOS and Android — allowing developers to integrate monitoring with minimal onboarding effort. This wide compatibility means Sentry can serve teams across the spectrum, from early-stage startups to large enterprises with diverse technology stacks.
Open-source flexibility and self-hosting is the second. As data compliance and privacy become increasingly critical, many organizations are reluctant to send sensitive error data to a third-party SaaS provider. Sentry's open-source nature lets teams deploy the entire system on their own infrastructure, maintaining data sovereignty while still benefiting from enterprise-grade monitoring capabilities.
An active community and rapid iteration pace is the third. Adding 214 Stars per day signals that the project retains strong momentum. Continuous feature updates and community contributions allow Sentry to stay aligned with evolving modern development practices.
Use Cases and Value
For any team running production services, Sentry deserves serious consideration. It's especially well-suited for: agile teams that need to respond quickly to production incidents, engineering cultures with high standards for code quality, and enterprises that must self-host their monitoring systems to meet compliance requirements.
From an engineering efficiency standpoint, the core problem Sentry solves is information latency. Without mature monitoring tooling, a production bug might not surface until a user complains — and tracing the cause can consume hours of log review. Sentry compresses this process into real-time alerting plus precise attribution, enabling development teams to maintain application stability proactively rather than reactively.
Conclusion
Sentry has secured its position in the competitive observability landscape by consistently thinking from the developer's perspective. It isn't just an alerting tool — it's an engineering efficiency platform that spans the entire "detect → diagnose → fix" workflow. For teams that care about application quality and developer experience, Sentry offers a mature, flexible, and community-backed solution. Whether you opt for the SaaS offering or self-hosted deployment, it meaningfully improves your incident response capability.
Additional Background
The primary method for self-hosting Sentry is the officially maintained self-hosted repository, which uses Docker Compose to orchestrate a service stack that includes PostgreSQL, Redis, Kafka, ClickHouse, and several other components. ClickHouse handles high-throughput event writes and queries, while Kafka provides buffering and load leveling at the data ingestion layer.
This means self-hosting carries non-trivial resource requirements. The official recommendation is a minimum of 4 CPU cores and 16 GB of RAM; production-grade deployments typically require more, along with a regular data cleanup strategy to keep disk usage under control. For smaller teams with limited resources, it's possible to deploy with only error tracking enabled to reduce overhead — or use the community-maintained Kubernetes Helm Chart to deploy on a container cluster for better elastic scalability.
Related articles

Huberman's Rational Supplement Guide: A Five-Layer Health Framework and Scientific Decision-Making
Stanford neurobiology professor Huberman proposes a rational supplement framework: behavior and nutrition are the foundation, basic combination supplements serve as insurance, and sleep/hormonal/cognitive directions should stick to single-ingredient experiments. Omega-3 is the top single-ingredient choice, and melatonin is not recommended.

The Unsung Painter Behind Gilded Age Manhattan Interior Design
HN discussion highlights the painter behind Gilded Age Manhattan interiors: he created murals and decorative paintings but was long overlooked as his work was seen as architectural appendage.

Can AI Agents Be Socially Engineered? Understanding Prompt Injection and Tool Permission Risks
Through Invariant Lab's GitHub Issue injection and Brave's AI browser attack, this article analyzes how Prompt Injection induces AI Agents to perform unauthorized actions, and offers protection advice across three layers: least privilege, tool validation, and operation auditing.