The Complete Guide to yfinance: Fetching Financial Data and Quantitative Analysis with Python

A comprehensive guide to using yfinance for fetching stock, financial, and options data in Python
This article systematically covers the complete usage of the Python financial data library yfinance, including environment setup, Ticker object creation, company fundamentals and financial statement queries, analyst ratings retrieval, historical OHLCV price data fetching, and options chain data access — helping developers quickly master this essential tool for quantitative research and financial application development.
yfinance is the most popular financial data library in the Python ecosystem. By wrapping Yahoo Finance's data endpoints, it provides developers with convenient access to stocks, funds, options, and other asset classes. Whether you're backtesting quantitative strategies, conducting investment research, or building financial applications, yfinance is the go-to solution for your data layer. This article walks you through every feature of yfinance from scratch, helping you fully master this powerful financial programming tool.
About the Data Source: Yahoo Finance does not offer an official public API. yfinance retrieves data by parsing its internal data endpoints, which means interface stability depends on Yahoo Finance's page structure — historically, it has experienced brief outages multiple times due to Yahoo adjusting its endpoints. yfinance was created by Ran Aroussi in 2017 and is maintained by an active open-source community. With over 15,000 GitHub stars, it's one of the most downloaded libraries in the Python financial data space.
Environment Setup and Getting Started
Before using yfinance, you need to install the necessary dependencies. The simplest approach is a one-line pip install:
pip install yfinance pandas jupyterlab
Once installed, import it in a Jupyter Notebook and you're ready to go:
import yfinance as yf
The core of yfinance is the Ticker class. Pass in a stock symbol to create a Ticker object that carries virtually all queryable information about that security:
ticker = yf.Ticker("AAPL")
This object exposes a wealth of attributes covering company fundamentals, financial statements, analyst ratings, news, and more — serving as the starting point for all subsequent operations.
Company Fundamentals and Financial Data
Comprehensive Information Query
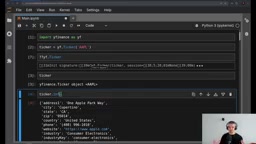
ticker.info returns a dictionary containing comprehensive company information: address, website, industry classification, business summary, key executives, as well as critical financial metrics like Forward PE and Earnings Per Share (EPS).
ticker.info["forwardPE"]  # Get forward P/E ratio
ticker.info["companyOfficers"]  # Get management information
This data serves as the foundational material for building value investing analysis tools or company research reports. Forward P/E is calculated based on analysts' earnings forecasts for the next 12 months. Compared to the trailing P/E based on historical data, it better reflects the market's pricing expectations for a company's growth potential, making it a core reference metric in growth stock valuation analysis.
Financial Statements and Analyst Ratings
yfinance provides full access to financial statements, all returned as Pandas DataFrames for easy downstream data processing and analysis:
ticker.quarterly_balance_sheet— Quarterly balance sheetticker.quarterly_cash_flow— Quarterly cash flow statementticker.quarterly_earnings— Quarterly earnings dataticker.quarterly_income_stmt— Quarterly income statement
ticker.analyst_price_targets retrieves the consensus analyst price targets, including the current price, highest/lowest targets, mean, and median — helping investors quickly gauge market expectations.
ticker.news returns the latest news related to the company, including titles, summaries, links, and thumbnails — perfect for building news aggregation dashboards. ticker.calendar lets you view upcoming important events, such as the next earnings release date and market expectations.
Historical Prices and Options Data
Fetching Historical Stock Prices
Retrieving historical prices is one of yfinance's most commonly used features. Using the ticker.history() method with the period parameter, you can pull OHLCV data across different time spans:
OHLCV Data Format Explained: OHLCV is the standard format for financial time series data, representing Open, High, Low, Close, and Volume. These five fields form the fundamental data unit for technical analysis and are the core elements for drawing Japanese candlestick charts (K-line charts) — candlestick charts originated in 18th-century Osaka rice markets before being adopted by Western financial markets. The DataFrame returned by yfinance is natively compatible with mainstream technical analysis libraries like TA-Lib and pandas-ta, allowing direct computation of Moving Averages (MA), Relative Strength Index (RSI), Bollinger Bands, and other technical indicators for strategy signal generation and backtesting.
ticker.history(period="6d")    # Last 6 trading days
ticker.history(period="10mo")  # Last 10 months
ticker.history(period="2y")    # Last 2 years
ticker.history(period="max")   # All available history
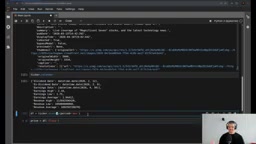
The returned DataFrame contains columns for Open, High, Low, Close, Volume, Dividends, and Stock Splits — the standard data format for drawing candlestick charts and performing technical analysis. Using Apple as an example, historical data can go as far back as 1980.
Options Chain Query
yfinance also supports options data retrieval. First use ticker.options to view all available expiration dates, then specify an expiration date to fetch the corresponding options chain:
expiration_dates = ticker.options  # Get all expiration dates
chain = ticker.option_chain(expiration_dates[0])  # Specify expiration date
chain.calls   # Call options
chain.puts    # Put options
The returned DataFrame contains bid/ask quotes, last traded price, and implied volatility for each strike price. Implied Volatility (IV) is not simply an extension of historical volatility — it represents the market participants' collective expectation of future price fluctuation magnitude, derived by reverse-solving pricing models like Black-Scholes using the option's market price. The level of IV directly reflects market sentiment: IV typically surges significantly before earnings releases and major events, creating what's known as the "volatility smile."
Related articles
 Tutorials
ChatGPT Plus Subscription Guide: Are GPT-5.5, image-2, and Codex Worth the Upgrade?
A detailed look at ChatGPT Plus features — GPT-5.5, image-2, and Codex — with a Plus vs Pro comparison and a complete step-by-step subscription guide for users outside the US.
 Tutorials
Harness AI Engineering in Practice: Using Claude Code to Master Enterprise-Level E-Commerce Development
Deep dive into Harness AI Engineering: master enterprise e-commerce development with Claude Code using the Rules, Skills, Wiki, and Changes framework.
 Tutorials
Cursor + Codex Dual-IDE Collaboration: A Practical Methodology for Open-Source Project Customization
A complete methodology for open-source project customization based on real-world experience, detailing the Cursor+Codex dual-IDE workflow, seven-stage process, MVP validation, and AI source code reading techniques.