Using AI to Debug AI: Three Battle-Tested Patterns from Incident.io

Incident.io uses three tooling patterns to let AI debug AI, breaking through manual debugging bottlenecks in complex AI systems.
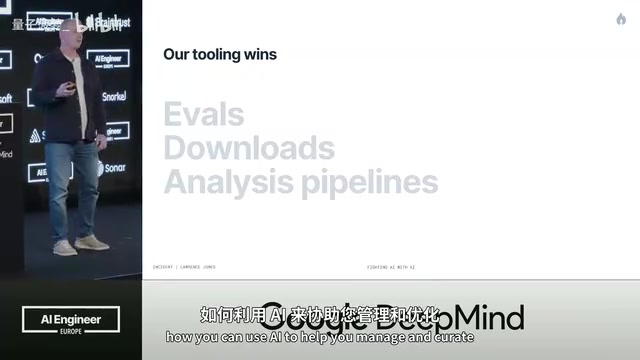
When AI system complexity exceeds human cognitive limits, Incident.io developed three patterns for using AI to debug AI: first, letting coding Agents manage Eval workflows through CLI tools and red-green cycles; second, exporting debug UIs as file systems so Agents can efficiently access full context for problem analysis and fixes; third, building repeatable AI analysis pipelines to batch-evaluate thousands of investigations and automatically identify root causes of quality degradation. Together, these patterns solve the core challenge of debugging multi-agent systems that are impossible to trace manually.
When AI systems become complex enough that humans can no longer understand and debug them alone, what do you do? Lawrence, a founding engineer at Incident.io, shared their answer at the AI Engineer conference: use AI to debug AI.
This company, which provides incident response management platforms for companies like Netflix, Etsy, and Skyscanner, is building an AI SRE product capable of fully automating production environment investigations. In the process, they discovered that traditional manual debugging methods simply couldn't keep up with system complexity, leading them to develop three proven internal tooling patterns.
What is AI SRE? SRE (Site Reliability Engineering) is an engineering practice first created by Google in 2003, with the core philosophy of applying software engineering methods to operations problems. Traditional SRE engineers need to manually respond to production incidents, analyze root causes, and coordinate fixes. With the proliferation of microservice architectures, observability data in modern systems has grown exponentially—a single production incident might involve thousands of log entries, hundreds of metric time series, and call chains spanning dozens of services, making the bottleneck of manual processing increasingly apparent. AI SRE is the attempt to hand this highly repetitive work, which requires extensive context correlation, over to AI systems for automatic completion.
The Core Problem: Complexity Has Exceeded Human Cognitive Limits
Incident.io's AI investigation system automatically executes hundreds of telemetry queries during each incident, checking logs, metrics, traces, and historical incident data, then cross-references the codebase to ultimately provide root cause analysis and remediation recommendations.
The Three Pillars of Observability Modern cloud-native system observability is built on three pillars: Logs record discrete events during system runtime; Metrics reflect time-series numerical data about system state, such as CPU utilization and request latency; Traces record the complete call chain of a single request across multiple microservices, helping locate performance bottlenecks and failure points in distributed systems. Incident.io's AI investigation system needs to process all three data types simultaneously and cross-reference them with codebase context—this is the fundamental reason its complexity exceeds human cognitive limits.
This sounds cool, but the problem follows immediately: how do you know whether the report is correct or incorrect?
To verify the quality of an investigation report, an engineer typically needs to spend about an hour deeply understanding the full context of an incident before they can judge whether the AI's analysis is accurate. Behind this system lie hundreds or thousands of prompts working in coordination—the chatbot alone involves over a dozen different agents and more than fifty tools. Not to mention that each step in the investigation system might expand into hundreds of different prompt calls and tool calls.
The Debugging Dilemma of Multi-Agent Systems Modern AI Agent systems are typically built on ReAct (Reasoning + Acting) or similar frameworks, allowing LLMs to dynamically invoke external tools during reasoning. When multiple Agents collaborate, the system forms a multi-agent network, with each Agent responsible for specific subtasks, coordinating through message passing or shared state. This architecture dramatically raises the system's capability ceiling but also causes debugging difficulty to grow exponentially—a slight deviation in one Agent gets progressively amplified through chain calls, ultimately leading to completely incorrect output, and the error propagation path is virtually impossible to trace manually across hundreds of tool calls.
Any subtle error in any step can cause the final root cause analysis to go completely off-track, and you have almost no way to manually trace the error's source.
Pattern One: Let Coding Agents Own the Eval Workflow
For Lawrence, Evals are the unit tests of AI. Each Eval takes input data, runs a prompt, gets output, then judges pass/fail based on scoring criteria. At Incident.io, these Evals are stored as YAML files alongside Go code prompts.
The Nature and Challenge of Evals Eval (Evaluation) in LLM engineering is equivalent to unit testing in traditional software, but its complexity far exceeds the latter. Because LLM output is probabilistic and non-deterministic, Evals typically need to define multi-dimensional scoring criteria including accuracy, relevance, format compliance, and more. In more complex scenarios, another LLM is even needed to serve as a judge (the LLM-as-Judge pattern), where one model evaluates another model's output quality. This nested structure of "using AI to evaluate AI" is the fundamental reason Eval maintenance costs are extremely high—test data, scoring criteria, and the prompt being tested can all evolve over time, and changes to any one of them can invalidate the entire test suite.
But Evals have a fatal problem: they are extremely difficult to maintain. Real production Evals might contain an entire incident report's data, with YAML files easily reaching several megabytes. When these files bloat to a certain size, coding Agents can't effectively handle them due to context window limitations.
Their solution was to build a lightweight CLI tool—eval tool—designed specifically for Agents. This tool provides a clean interface: query test cases, edit, replace, add new ones, allowing the Agent to work without loading the entire massive YAML file into context.

On top of this, they wrote a dedicated runbook for the coding Agent, defining a complete red-green cycle:
- Create a failing Eval: Prove that the current prompt has a problem
- Modify the prompt: Make the new Eval pass
- Regression verification: Ensure the modification hasn't broken other Evals
- Slim down the prompt: Prevent repeated modifications from causing prompt bloat
In practice, an engineer only needs to point Claude Code at an Eval, describe the expected behavior, and the Agent automatically completes the entire fix workflow. Lawrence demonstrated a real prompt optimization process for converting human queries into Loki log queries, where the Agent automatically added Evals, verified pass rates multiple times—the entire process was smooth and efficient.
Pattern Two: Transform Debug UI into a Downloadable File System
Lawrence considers this their biggest breakthrough.
They had previously built beautiful debug UIs for humans to view traces and inspect each Agent's decision path. But the problem was: Agents can't use these UIs. They considered MCP and other approaches, but ultimately found a simpler, more powerful method—download all UI content as a file system.
Why File Systems Beat MCP MCP (Model Context Protocol) is an open standard released by Anthropic in late 2024, designed to provide LLMs with unified access to tools and data sources—similar to a "USB port" for AI, allowing AI models to connect to databases, APIs, file systems, and other external resources through a standardized protocol in real-time. However, Lawrence's engineering practice reveals a counterintuitive conclusion: for debugging scenarios, MCP's real-time connection model is actually less efficient than bulk file downloads. The reason is that debugging is fundamentally an exploratory task requiring extensive context correlation—Agents need to freely search and cross-reference across hundreds of prompt call records, and a bulk-downloaded file system gives the Agent complete offline context, allowing it to leverage its own semantic understanding capabilities to navigate autonomously, without the overhead of frequent network round-trips and tool calls.
The specific approach: for each AI interaction (investigation, chat, etc.), the system can export all relevant information as a structured file directory. These files contain all prompt inputs and outputs, tool call results, and complete trace information. Even complex trace visualizations can be precisely converted to ASCII text format, which LLMs understand surprisingly well.
This completely transformed their debugging workflow:
- Receive user feedback that an AI experience was poor
- Download the complete file system of that interaction to a sandbox environment
- Open it in Claude Code and let the Agent analyze the problem
- The Agent combines codebase context to locate the specific place that needs modification
- Complete the fix directly in the same session and verify with Evals
Lawrence specifically emphasized: file systems are an exceptionally good context vehicle for Agents. Compared to MCP or other complex integration methods, bulk downloading all information and letting the coding Agent search and analyze on its own works much better.
Pattern Three: Build Repeatable AI Analysis Pipelines
Debugging individual investigations was solved, but Incident.io runs thousands of investigations across hundreds of customer accounts every day. They have a system called "back test" that batch-runs investigations daily and aggregates an overall quality score (for example, 86% of investigations meeting quality standards).
But when the score drops, you need to understand why. Manually analyzing each one is obviously impractical.
They created a system called "scrapbook"—an AI analysis pipeline that automatically processes batch evaluation results, identifies patterns and common failure modes, and surfaces the root causes of quality degradation. This transforms what would be an overwhelming manual analysis task into an automated, repeatable process that can run alongside every batch evaluation.
Related articles
 Tutorials
ChatGPT Plus Subscription Guide: Are GPT-5.5, image-2, and Codex Worth the Upgrade?
A detailed look at ChatGPT Plus features — GPT-5.5, image-2, and Codex — with a Plus vs Pro comparison and a complete step-by-step subscription guide for users outside the US.
 Tutorials
Harness AI Engineering in Practice: Using Claude Code to Master Enterprise-Level E-Commerce Development
Deep dive into Harness AI Engineering: master enterprise e-commerce development with Claude Code using the Rules, Skills, Wiki, and Changes framework.
 Tutorials
Cursor + Codex Dual-IDE Collaboration: A Practical Methodology for Open-Source Project Customization
A complete methodology for open-source project customization based on real-world experience, detailing the Cursor+Codex dual-IDE workflow, seven-stage process, MVP validation, and AI source code reading techniques.