VibeFlow: A Practical Deep Dive into Natural Language-Driven CFD/CAE Post-Processing Automation

VibeFlow uses natural language and AI Agents to automate CFD/CAE post-processing workflows.
VibeFlow introduces a paradigm shift in CFD/CAE post-processing by enabling engineers to use natural language and screenshots to drive visualization and analysis tasks. Through demos of cavity flow velocity contours, pressure contour overlays, structural deformation comparisons, and bending moment calculations, it showcases how AI Agents can replace complex manual workflows with intuitive, multimodal interactions.
The Pain of the Post-Processing Learning Curve: The Hidden Time Cost for Engineers
In computational fluid dynamics (CFD) and computer-aided engineering (CAE) workflows, post-processing is often an underestimated yet extremely time-consuming step. Engineers need to master specialized software like ParaView, Tecplot, and CFD-Post — from loading result files, creating slices, and visualizing streamlines, to extracting data and comparing it with experimental results. Every step comes with a steep learning curve.
ParaView is an open-source data analysis and visualization application developed by Kitware, built on VTK (Visualization Toolkit), and widely used for large-scale data visualization in scientific computing. Tecplot is a leading commercial CFD post-processing tool, renowned for its publication-quality graphical output. CFD-Post is the post-processing module within the ANSYS suite, deeply integrated with the Fluent and CFX solvers. While all these tools are powerful, each has its own operational logic, scripting language, and data format requirements. Engineers often need months to become proficient with just one of them.
VibeFlow (WebFlow) proposes an entirely new approach: describe the results you want to see in natural language, and let an AI Agent handle all the post-processing automatically. Engineers don't need to memorize complex software workflows — they simply tell the system what they need, as naturally as talking to a colleague: "I want to see pressure contour lines" or "Calculate the bending moment at this cross-section." The AI takes care of the rest.
Fluid Dynamics Post-Processing Demo: From Velocity Contours to Vector Overlays
In the demo video by a Bilibili creator, the first showcase features a completed two-dimensional cavity (Cavity) flow simulation. Lid-Driven Cavity Flow is one of the most classic benchmark problems in computational fluid dynamics. The physical model consists of a closed square cavity where the top wall moves horizontally at a constant velocity while the other three walls remain stationary. Despite its apparent simplicity, this problem contains rich flow physics — primary vortices, corner vortices, secondary vortices — and exhibits different flow characteristics at various Reynolds numbers. Due to its simple geometry, well-defined boundary conditions, and abundant reference solutions in the literature (such as the classic numerical solutions by Ghia et al. in 1982), cavity flow is widely used to verify the correctness of CFD codes and the visualization capabilities of post-processing tools.
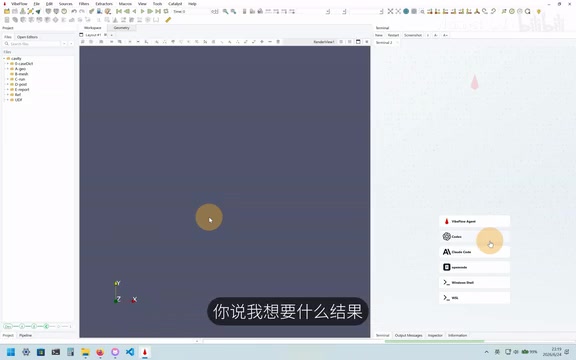
In the initial state, the Workspace is completely empty — no result files need to be loaded manually. The user simply types what they want to see in the dialog box, and the AI Agent begins working automatically. You can see it automatically loading VF-prefixed result files in the Pipeline and directly displaying a velocity field contour. The entire process requires no mouse clicks or menu navigation.
Incrementally Layering Visualization Elements
Even more impressive is that users can progressively add visualization requirements:
- Generate pressure contour lines: Type "I want to see pressure contour lines" — the AI automatically generates a script, and the interface immediately displays the pressure contour plot
- Overlay velocity vectors: Type "Overlay velocity vectors" — the AI adds velocity vector arrows on top of the existing contour lines, with arrow sizes automatically scaled by velocity magnitude and directions pointing along the velocity field
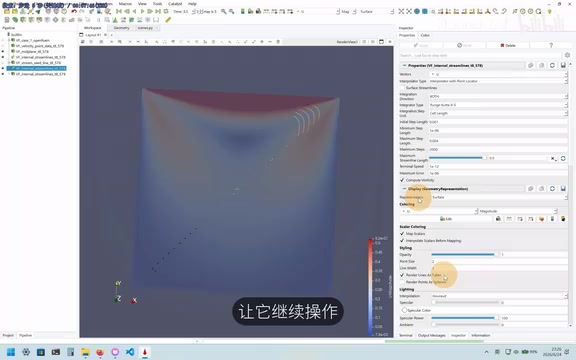
This interactive, progressive post-processing approach stands in stark contrast to traditional software, where each visualization module must be configured individually. The AI not only understands the user's intent but also automatically handles details like color mapping and arrow scaling.
Structural Mechanics Post-Processing: From Deformation Visualization to Bending Moment Calculation
The second part of the demo switches to a structural mechanics scenario, showcasing VibeFlow's capabilities in CAE post-processing.
Automatic Loading and Multimodal Data Extraction
The user tells the AI "I want to load the results," and the system automatically identifies and reads VTU-format result files output by the CCX (CalculiX) solver, completing the loading in the Pipeline and displaying the stress distribution. CalculiX is an open-source finite element analysis solver that supports linear and nonlinear statics, dynamics, heat conduction, and many other analysis types. Its input format is compatible with the commercial software Abaqus syntax, reducing migration costs for users. VTU (VTK Unstructured Grid) is an unstructured mesh data format defined by the VTK framework, using XML encoding to store node coordinates, element connectivity, and scalar, vector, and tensor physical quantities at nodes and elements. Due to the openness of the VTU format and ParaView's native support, it has become the de facto standard post-processing data exchange format in the open-source CAE toolchain.
Next, the user performed a particularly interesting operation — drawing a red line directly on the interface, taking a screenshot, and sending it to the AI, requesting it to calculate the bending moment at that location. The AI recognized that the red line was approximately at x=2.0, then performed an area integral of the axial stress over the cross-section, automatically calculated the bending moment value, and annotated the red line position and axial stress distribution in the figure.
In structural mechanics, calculating the cross-sectional bending moment is essentially a moment integral of the stress distribution over the cross-section. Specifically, for the bending moment M about a neutral axis, the formula is M = ∫σ·y·dA, where σ is the axial normal stress, y is the distance from the integration point to the neutral axis, and dA is the differential area element. In discretized finite element results, this integral is computed through numerical summation over the Gauss integration points of all elements on the cross-section. In the traditional approach, engineers need to manually create a cutting plane, extract stress data, and write integration scripts — a process involving coordinate system definitions, interpolation method selection, and many other technical details. In VibeFlow, all of this is simplified to a screenshot and a single sentence.
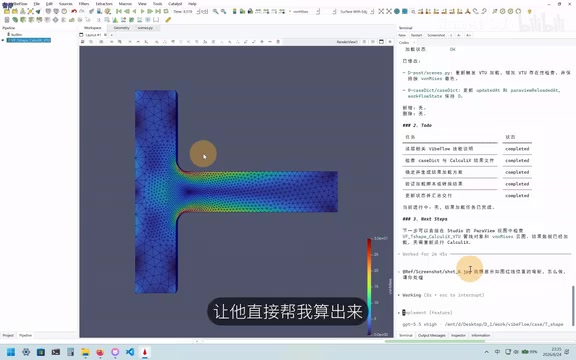
This multimodal interaction (text + screenshot) dramatically lowers the barrier to entry. In traditional workflows, users would need to manually input precise coordinates, create cutting planes, and write post-processing scripts to accomplish the same task.
Cross-Section Mesh and Deformation Comparison
The subsequent demo further showcases the AI Agent's flexibility:
- Cross-section mesh visualization: The user requests a Clip (cutting plane) at the red line position to view internal mesh elements. The AI completes the operation automatically, displaying a cross-sectional view of tetrahedral mesh elements generated by Gmsh on the right side
- Deformation comparison: The user requests a simultaneous display of "actual displacement deformation" versus the "initial state." The AI loads both states, setting the undeformed initial state as a semi-transparent gray mesh and overlaying the deformed state with a colored stress contour, creating an intuitive comparison
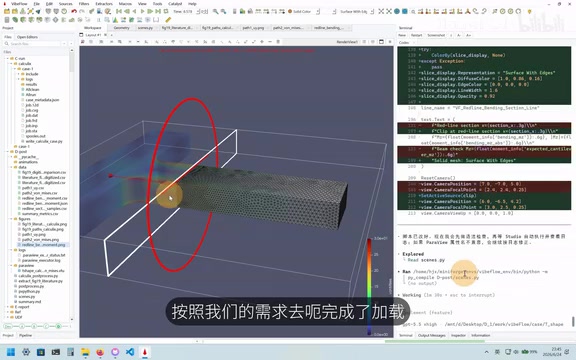
You might not have noticed, but the AI didn't just complete the basic operations — it also proactively applied visual optimizations, such as making the initial state semi-transparent. This is the kind of thing only an experienced engineer would think to do, suggesting that the underlying Agent possesses a degree of engineering post-processing "common sense."
Technical Architecture Analysis: How the AI Agent Drives the Post-Processing Pipeline
From the demo, we can infer that VibeFlow's technical architecture roughly includes the following key components:
- Natural Language Understanding Layer: Parses the user's text descriptions and screenshot information to extract visualization intent and parameters
- Script Generation Engine: Translates user intent into ParaView/VTK Python scripts (judging from the Pipeline operations in the demo, the underlying system is very likely based on ParaView)
- Multimodal Input Processing: Supports screenshot recognition and can extract spatial information such as coordinate positions from images
- State-Aware Mechanism: The Agent can perceive the current Workspace state (what files are loaded, what visualization elements exist), enabling incremental operations
The advantage of this architecture lies in combining domain knowledge (CFD/CAE post-processing best practices) with the reasoning capabilities of large language models, enabling the AI not only to execute instructions but also to make reasonable default choices. Notably, the state-aware mechanism is key to enabling "progressive post-processing" — the Agent needs to maintain a complete Scene Graph that records the properties and hierarchical relationships of all current visualization objects. This way, when the user says "overlay velocity vectors," it accurately understands that a new element should be added on top of the existing visualization, rather than replacing existing content.
The Significance and Outlook of VibeFlow for Engineering Simulation
For the CFD/CAE field, VibeFlow represents an important paradigm shift:
- Lowering the entry barrier: Junior engineers no longer need to spend weeks learning post-processing software to quickly obtain and present simulation results
- Boosting productivity: Experienced engineers can also use natural language to rapidly complete repetitive post-processing tasks
- Facilitating collaboration: Project managers or clients without technical backgrounds can directly explore and view simulation results using natural language
Of course, for highly customized or finely tuned visualization needs, AI-generated results may still require manual adjustments. But as an efficiency tool for everyday post-processing, VibeFlow demonstrates the enormous potential of AI Agents in the engineering simulation domain.
Looking ahead, as multimodal large model capabilities continue to improve, similar Agent-driven tools are expected to cover the entire simulation workflow — from pre-processing (meshing) to solver setup to post-processing — truly realizing the vision of "running simulations with natural language." Multimodal large models (such as GPT-4V, Gemini, etc.) can simultaneously process text, image, and even video inputs, bringing an entirely new human-computer interaction paradigm to engineering. In CAE scenarios, engineers' work is inherently highly visual — they need to observe stress concentration zones in contour plots, identify flow separation points in streamlines, and recognize mesh quality issues. Multimodal models enable AI to "see and understand" these engineering images and interpret the meaning of engineers' annotations on screenshots, enabling an interaction upgrade from "describing the problem" to "pointing at the problem." This capability, combined with domain-specific fine-tuning in engineering, has the potential to give rise to AI engineering assistants that truly understand physical intuition.
Key Takeaways
Related articles
R&D Is Forking: The Coming Battle Between Token-Abundant and Token-Starved Research
R&D is splitting into token-abundant and token-starved research. Top AI labs are pulling ahead—here's what it means for universities and the future of science.

Atlas World Model Explained: How Next View Prediction Unifies Generation and Reconstruction
The Atlas world model uses Next View Prediction as its core to unify pixel-level generation and reconstruction, offering a new approach to spatial intelligence.

Resumate: A Deep Dive into the Repair-and-Resume Layer for LangGraph Agents
Resumate adds memory-aware checkpointing and idempotent side-effect protection to LangGraph agents, preventing issues like duplicate Stripe charges on retry.