When AI Says 90% Confidence — Should You Trust It? Probability Calibration and Agent Decision-Making in Practice

A high probability score isn't a green light — here's how to validate AI confidence before automating Agent decisions.
Using a customer service withdrawal ticket as a case study, this article explains how to correctly interpret and use model probabilities in Agent automation. The core argument: a model's 90% confidence is a statistical statement about a batch of predictions, not a guarantee for any single request. Evaluating a decision model requires three separate checks — overall accuracy, per-band calibration, and whether the scores can meaningfully separate high- and low-confidence cases. The article also provides actionable engineering guidance: decompose problems cleanly, use thresholds rather than chasing high numbers, run shadow mode tests before going live, and strictly separate tuning data from acceptance data.
A customer service ticket comes in: "My withdrawal has been failing for three days. Please look into it." You want an Agent to automatically route it to the right team. The model picks the billing team and assigns this choice a confidence of "90%." Seeing that number, would you let the system execute automatically?
In this video, Bilibili creator Jev uses a withdrawal ticket as a running example to walk through the complete Agent decision-making process: understand the probability first, check the evidence, then decide when to automate and when to hand off to a human. The central argument is clear — a high probability score is not an unconditional green light for execution.
What Does "90%" Actually Mean?
A decision model (referred to as the Jev-type model in the video) takes input materials and a question, then returns candidate answers with associated probabilities. Ask "which team should this be routed to?" and it might return: billing team 90%, tech team 7%, other 3%. Billing coming out on top only means the model most favors that choice — whether to actually execute the routing depends on the rules written in your code.
The easiest trap here is confusing "the probability that the model's classification is correct" with "how urgent this customer's issue is." The 90% reflects the model's confidence in its own classification judgment — it has nothing to do with business urgency.

More critically: probability helps us manage risk across a batch of requests — it is not a guarantee for any single ticket. Even with a well-calibrated model reporting 90%, one in ten tickets in that batch may still be wrong. For the ticket in front of you right now, that 90% cannot tell you whether it belongs to the correct 90 or the mistaken 10.
Accuracy, Calibration, and Routing Ability: Three Separate Questions
Jev repeatedly emphasizes in the video that evaluating a decision model requires asking three distinct questions — don't use a single metric to answer everything.
Accuracy: How Many Did It Get Right Across the Batch?
Run 100 tickets with verified answers through the model. If it routes 95 correctly and 5 incorrectly, accuracy is 95%. But this is just the aggregate score for the whole batch. It doesn't answer whether those 5 errors are concentrated in tickets the model was uncertain about.
Calibration: When It Reports 90% Confidence, Is the Actual Rate Close to 90%?
Look at it differently — pull out all 100 predictions from historical records where the model reported "90% confidence," then manually verify how many were actually correct. If about 90 were right, this confidence band aligns well with reality. If only 60 were right, the model is overreporting its confidence.

This band-by-band verification is called calibration. Note that good calibration doesn't mean the model knows in advance which tickets will be wrong — it tests whether the probability labels are reliable as a whole, which is a separate question from accuracy.
A note on calibration: The concept of Calibration comes from probability theory and statistics, originally used to evaluate the reliability of forecasts in fields like weather prediction. In machine learning, a "well-calibrated" model means its reported probabilities closely match actual frequencies — predictions made with 70% confidence should be correct about 70% of the time over many instances, and those at 90% should be right about 90% of the time. A common tool for checking calibration is the Reliability Diagram, where the x-axis shows the model's reported probability intervals and the y-axis shows the actual accuracy within each interval; ideally, all points fall along the diagonal. A widespread problem is overconfidence: reported probabilities are systematically too high, with actual accuracy falling below the stated values. This is a separate dimension from accuracy — a model can have high accuracy but poor calibration (reporting 99% on everything while only being correct 85% of the time), or moderate accuracy but good calibration. Engineering solutions include post-processing methods like Temperature Scaling and Platt Scaling, which can recalibrate the output probability distribution without changing the model's prediction rankings.
Routing Ability: Can These Scores Help Us Identify What's Safe to Automate?
Compare two models on the same batch: Model A and Model B both get 90% of tickets right — same accuracy. But Model A reports 90% confidence on all its choices, while Model B reports 99% on all of them. In this example, Model A's confidence is closer to reality, while Model B is overconfident — and looking at accuracy alone, you'd never catch this difference.
More extreme: if a model reports the same number for every ticket (say, 90% across the board), even if overall accuracy is also 90%, those scores give you no way to identify a more reliable subset — you either accept everything or block everything. What's genuinely useful is a model that reports high confidence on clear cases and low confidence on ambiguous ones, and where both hold up under verification. Only then does a decision threshold have real meaning.
Independent Testing: Encouraging Signals, With Limits
Jev draws an important distinction: any model can output the number "90%" in the right format, but returning a set of numbers and having those numbers independently validated are two different things. So the real question is: has anyone actually checked them against ground truth?
The video references an independent developer's evaluation — testing Jev across 1,200 multiple-choice questions spanning multiple subject areas. Looking only at the highest-confidence tier: the model reported an average confidence of 98.7%, with an actual accuracy of 96.3% — a gap of about 2.4 percentage points. The model still leans overconfident, but within this tier the reported confidence and actual performance are fairly close. That's an encouraging signal.
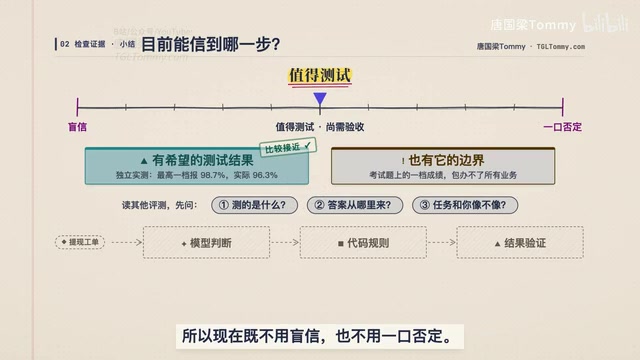
But this result can't be directly transplanted to your own business. Exam multiple-choice questions and company customer service tickets are fundamentally different tasks: how customers phrase things, how teams are organized, what information is typically missing — all of these vary. A model that was well-calibrated in one setting may drift in another. This is what cross-task calibration is about — someone else's report card cannot substitute for verification in your own domain.
The video also flags several traps when reading benchmarks: speed benchmarks measure time, price benchmarks measure cost — neither proves that probabilities are trustworthy. If the "ground truth" labels come from another model, high scores first indicate that the two models agree, not that the reference answers are correct. And selecting from predefined options means format compliance doesn't equal correct business judgment.
Jev's API also includes a confidence field derived from the raw probabilities. For a three-option case where the top probability is 90%, this field computes to 0.85. But don't read 0.85 as "this answer has an 85% chance of being correct" — it's just the same underlying numbers expressed differently. For decision-making purposes, use only the raw probability of the selected team.
On cross-task calibration: The fundamental issue is that a model's probability outputs are learned from a specific training distribution. When the input distribution shifts, the reliability of those probabilities drifts with it — but the model has no awareness of this and continues outputting numbers with the same apparent confidence. Multiple-choice knowledge questions have clear answers, well-defined option boundaries, and relatively uniform domain distribution. Customer service tickets, by contrast, are often incomplete and conversational — the same business issue might be described in dozens of different ways. This means a model well-calibrated on knowledge questions may be systematically over- or under-confident on ticket classification — not because the model has "gotten worse," but because the uncertainty structure of the new task differs from what it saw during training. In practice: collect at least a few hundred business data points with human-verified labels, group them by the model's reported probability intervals (e.g., 0.7–0.8, 0.8–0.9, 0.9–1.0), compute actual accuracy within each group, plot a reliability diagram for your specific business context, and then decide where to set your threshold.
Connecting the Model, the Code, and the Verification
Back to the withdrawal ticket — Jev provides a concrete, engineering-ready methodology.
Break Down the Problem, and Clean Up the Options
Asking "what should be done with this ticket?" forces the model to simultaneously guess the team, priority level, and next action. When something goes wrong, it's hard to pinpoint why. Better to split it up: Which team should this go to? Does it need escalation? Is all necessary information present? Let the model answer each separately, then have the code combine the results.
The options themselves also need to be defined clearly. In this example: payments and withdrawals go to billing, system failures go to tech, everything else goes to "other." Note that "other" is a defined residual category, while "not sure" means the model lacks confidence in its choice — these are not the same thing and shouldn't be collapsed into one bucket.
Set a Threshold — Don't Just Chase Higher Numbers
Give your code a candidate rule: automatically route only when the selected team's probability reaches 0.95; otherwise, send to a human. This cutoff is the threshold. The withdrawal ticket at 0.90 goes to manual review; another ticket that reports 0.99 with clear information passes through. A higher threshold isn't always better — set it too high and you push the majority of requests back to humans. The goal is finding the right balance point.
Shadow Mode Testing
Before going live, run the process in trial mode: keep the existing customer service workflow running as normal, but send a copy of each ticket to the new model as well — only logging which team it would have chosen and with what confidence, without actually routing anything. This is called shadow mode. The key advantage is that you can observe behavior without affecting customers. Logs should retain the original text, the options, the selected probability, and the model version — all of which you'll need to diagnose failures later.

On shadow mode: Shadow mode is standard safety practice when deploying new models in large-scale systems, and is especially common in high-stakes domains like finance, ad recommendation, and content moderation. The core idea is to "clone" production traffic to the new system, which runs normally and logs its decisions — but its output has no effect on real outcomes. This design lets engineers accumulate statistical data under real traffic distributions, rather than relying on manually constructed test sets, since real users' phrasing habits, edge cases, and data noise are rarely fully reproducible in offline testing. A few common implementation details: ensure both pipelines receive identical inputs to avoid contamination from timing or preprocessing differences; log volume doubles, so plan storage and querying capacity in advance; and observe for long enough to cover cyclical business patterns (such as end-of-month withdrawal spikes). Only after accumulating sufficient samples in shadow mode — with metrics consistently meeting targets — should you begin gradually shifting traffic, such as 1% first, then 10%, then full rollout.
Tuning and Acceptance Testing: Don't Adjust the Rules While Peeking at the Answers
Split your labeled data into two batches: one for tuning the threshold (the tuning set), and one reserved for final acceptance testing. Think of it like practice versus the real exam — you can't adjust the rules while looking at the test answers.
The video uses a worked example with teaching data: 1,000 tickets in the tuning set. At threshold 0.90, 800 tickets are auto-processed with 40 errors (80% automation rate, 5% error rate). Raise to 0.95: 500 tickets auto-processed, 10 errors (50% automation, 2% error rate). Raise to 0.98: only 200 tickets auto-processed, 2 errors. That's the tradeoff you're navigating. If the team can accept an auto-processing error rate below 3%, pick 0.95 as the candidate.
Then run your separate 1,000-ticket acceptance batch without making any further adjustments: 480 tickets pass through, 12 are misclassified — a 2.5% error rate that meets the target. Only then should you consider a limited rollout. After launch, continue monitoring — model version updates, changes in how customers phrase requests, and shifts in team routing rules can all invalidate a previously valid threshold.
Three Questions, Three Takeaways
How do you read a probability? Group predictions with similar confidence levels together, check them against ground truth, and don't treat probability as a per-ticket guarantee.
Can you trust Jev's probabilities? Independent testing provides encouraging signals, but you still need to re-validate in your own business context. Be clear about what the evidence actually supports.
How should an Agent use them? Break the problem into clean pieces and let code govern the actions. Start with shadow mode logging, then validate on a held-out dataset, and choose an error rate and manual workload tradeoff you can live with.
The model provides judgment. Rules constrain actions. Results verify the entire pipeline. Don't let a single high-probability number become a blanket authorization for every operation that follows.
Related articles

Why Does the Tesla Roadster Need to Fly? A Deep Dive into Musk's Wild Demo
Tesla's Roadster launch showed wall-climbing, upside-down driving, and flying stunts—but The Vergecast notes the demo car may lack a battery, the Rocket version is invite-only and not street-legal, and the website terms don't guarantee delivery. After nine years of delays, why does this car still need to exist?

AI Is Not a Replacement: Human-AI Collaboration Through the Lens of Factory Root Cause Analysis
Starting from factory root cause analysis, this article explains how AI accelerates evidence chain construction rather than replacing human experts, exploring the pragmatic implementation logic and business value of 'AI supporting people rather than replacing them.'

AI Agent Decision Auditing: Building an Evidence Chain in Regulated Workflows
Starting from a Reddit discussion, this article analyzes three core issues in AI agent decision auditing within regulated workflows: what fields audit records should contain, how to handle feedback latency for erroneous decisions, and how to continuously calibrate LLM judge consistency with human judgment.