10 Years, 109k ML Papers Compressed into ~1,000 Topic Pages: Benchmark Records, Ablations, and Reviewer Expectations on One Page

A team aggregated ~109k papers from five top conferences over ten years into 1,260 topic pages showing benchmark records, ablations, and baseline distributions.
A team extracted data from about 109,000 accepted papers at ICML, NeurIPS, ICLR, CVPR, and AAAI since 2016, aggregating them into single-page views for about 1,260 topics, and pulled results tables and ablation data from 79,000 full texts. Each topic page shows a timeline of the best results on each benchmark and the corresponding papers, ablation experiments from recent papers (including failed attempts), common comparison baseline distributions, and the latest arXiv preprints and BibTeX, with every number linking back to the original text. The team explicitly states that data extraction is imperfect and that cross-paper numbers are not always comparable, positioning it as a research starting point rather than a leaderboard, and that 2026 paper data has not yet been included. The tool is free and requires no registration, aiming to change the starting point of literature review.
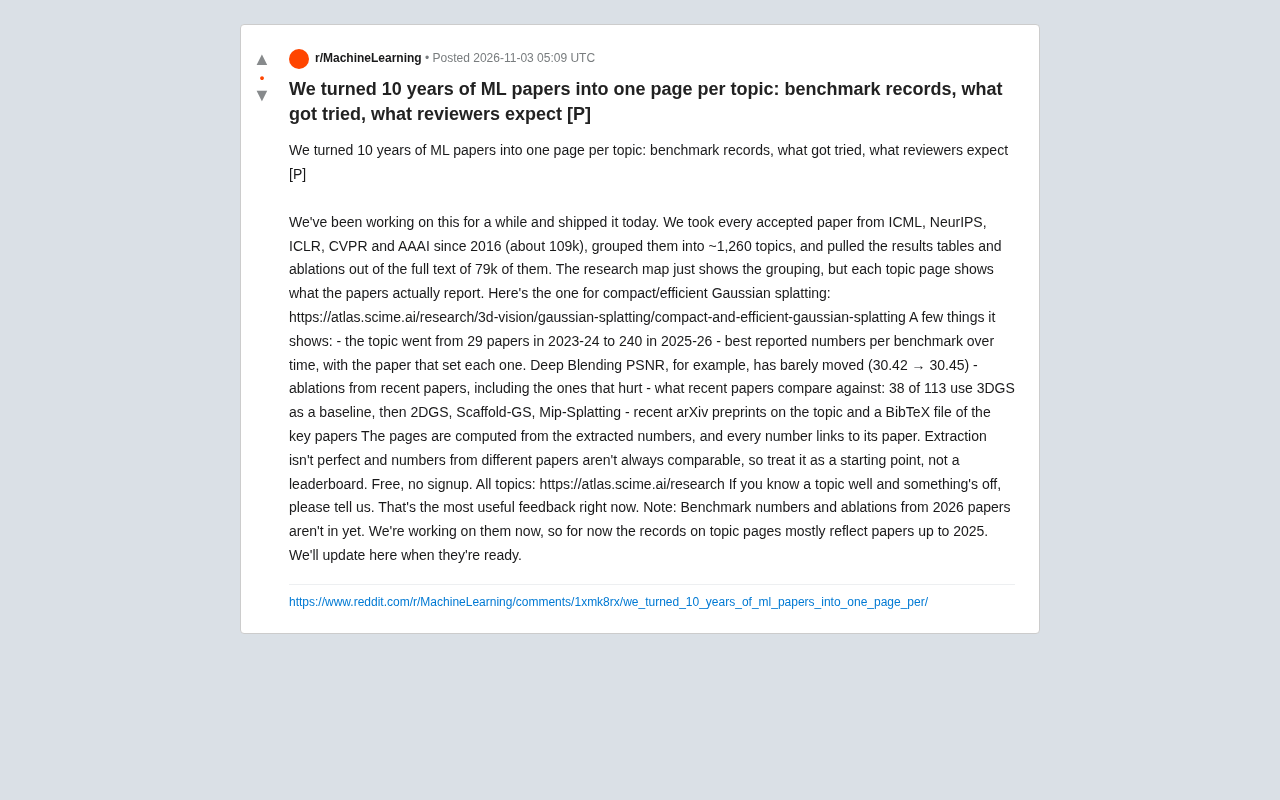
Anyone who does machine learning research has probably had this experience: to get into a subfield, you first have to manually dig through hundreds of papers' results tables to figure out which benchmark has been pushed to what level, which methods have been tried and failed, and what reviewers actually care about. A team has automated this — they extracted data from all accepted papers at ICML, NeurIPS, ICLR, CVPR, and AAAI since 2016, aggregated it by topic into single-page views, and recently launched it officially.
Data Scale: How 109k Papers Became 1,260 Topics
According to the project's launch post on Reddit, the team collected about 109,000 accepted papers from five top conferences since 2016, grouped them into roughly 1,260 topics, and extracted results tables and ablation data from the full text of 79,000 of those papers.
What's notable about this scale is the coverage: it's not a sample but all accepted papers; it's not just abstracts but deep full-text parsing of tables. The result is a searchable research map that lets researchers see the evolution of a subfield without reading paper by paper.
The example topic given in the post is compact and efficient Gaussian splatting, and the page shows the direction growing from 29 papers in 2023-24 to 240 in 2025-26 — the shift in热度 (popularity) is clear at a glance.
Top conferences (ICML/NeurIPS/ICLR/CVPR/AAAI) are the recognized flagship venues in machine learning and computer vision, and their accepted papers typically represent the most closely watched research directions of the year. ICML, NeurIPS, and ICLR lean toward machine learning theory and methods, CVPR toward vision, and AAAI covers a broader range of AI topics. Using accepted papers from these conferences as the corpus means covering the core output of the mainstream research community, but it also misses journal papers and work from some subfield-specific venues (such as ACL and EMNLP for NLP) — something to keep in mind when understanding the tool's coverage boundaries.
arXiv preprints are public versions of papers posted before formal publication, and the vast majority of machine learning work is uploaded to arXiv first. Their advantage is timeliness, reflecting the latest progress; the cost is that they are not peer-reviewed, vary in quality, and are constantly updated in new versions. By displaying the latest arXiv preprints alongside published papers, the topic pages are effectively a compromise between "authority" and "freshness."
What's Actually on a Topic Page
Each topic page is generated from extracted numerical values, and every number links back to the original paper. Taking the Gaussian splatting page as an example, several types of information are visible:
- A timeline of benchmark records: the best numbers reported on each benchmark, and which paper set them. The post specifically notes that Deep Blending PSNR has barely changed (30.42 → 30.45), and this kind of "stagnation" is itself a valuable signal.
- Ablation experiments from recent papers: including attempts that made results worse. Negative results are often the hardest to find in the literature, yet they have been systematically aggregated here.
- Comparison baseline distribution: who recent papers are comparing against. In the example, 38 of 113 papers use 3DGS as a baseline, followed by 2DGS, Scaffold-GS, and Mip-Splatting. This effectively sketches out the field's "default frame of reference."
- The latest arXiv preprints and BibTeX files for key papers, making it easy to move straight into writing.
Access is free and requires no registration, with all topics available at atlas.scime.ai/research.
Ablation study is an experiment in machine learning papers used to verify "whether a component is actually useful": keeping other conditions unchanged, modules in a model are removed or replaced one by one to observe changes in performance. Positive ablations show that a design brings improvement, while negative ablations — where adding a module actually makes results worse — are equally informative, telling later researchers which routes have already been tried and don't work, avoiding repeated pitfalls. Because such negative results lack a "highlight," they are rarely written up as standalone papers and usually only appear scattered in tables in the main text, so systematically aggregating them is a relatively valuable part of this tool.
Baseline refers to the reference methods used for comparison in a paper. As a field matures, it often converges on a set of "default baselines," and reviewers will usually question the persuasiveness of a new paper if it doesn't compare against them. Counting the baseline distribution of recent papers indirectly depicts the field's consensus frame of reference and can also help judge which methods have become "must-compare" items.
Clearly Positioned: A Starting Point, Not a Leaderboard
The team is quite candid about the limitations, which actually increases the tool's credibility. They explicitly state that data extraction is not perfect and that numbers across different papers are not always comparable, so it should be treated as a research starting point rather than a leaderboard.
This reminder is crucial. Experimental setups in machine learning papers vary enormously — dataset splits, preprocessing, and evaluation protocols all affect numbers, and direct cross-paper comparisons are inherently risky. The tool's value isn't in providing an authoritative ranking but in letting you quickly know "roughly how far this direction has been pushed" and "which routes have already been tried."
Another timeliness gap: benchmark numbers and ablation experiments from 2026 papers have not yet been included, so the records on topic pages mainly reflect papers up to 2025; the team says this is being processed and will be updated.
Leaderboard usually refers to a ranking of methods under a fixed dataset, fixed split, and fixed evaluation script, such as the various benchmark rankings on Papers with Code. The numbers on leaderboards are comparable because evaluation conditions are strictly standardized; numbers extracted from tables in the main text of different papers often come from their own different experimental setups — the two are fundamentally different in nature. This also explains why the team repeatedly emphasizes "a research starting point rather than a leaderboard" — once readers treat extracted numbers as authoritative rankings, they may draw incorrect conclusions.
PSNR (peak signal-to-noise ratio) is a quality metric commonly used in image and 3D reconstruction, where a higher value means the reconstructed result is closer to the real image, in decibels (dB). On datasets like Deep Blending, a PSNR improvement of 0.03 dB is nearly imperceptible, so a tiny change like "30.42 → 30.45" usually means the benchmark is approaching saturation, leaving limited room for method improvement, and researchers may want to turn to new evaluation scenarios.
What This Means for Researchers
What this kind of tool may change is the starting point of literature review. The traditional process is "read surveys → follow citations → dig through tables," and now there's an additional entry point: first look at the topic page to grasp the big picture, then selectively read in depth. For researchers entering from another direction, students who need to quickly judge whether a topic has already been thoroughly explored, and authors curious about reviewer expectations, this aggregated view can save considerable screening time.
Of course, the accuracy of automated extraction needs validation by domain experts. The team directly asks for feedback in the post: "If you're familiar with a topic and find problems, please let us know" — this is probably the most useful input they can get right now.
From a broader perspective, structuring ten years of top-conference papers is itself a quantitative observation of the research ecosystem: which benchmarks have stagnated, which baselines have become consensus, and which attempts have been repeatedly proven ineffective. This information used to be scattered across countless papers' main texts; now it's placed on the same page.
One-line Summary
A team aggregated about 109k papers from five top conferences over ten years into 1,260 topic pages, showing benchmark records, ablations, and baseline distributions.
Paragraph Summary
A team extracted data from about 109,000 accepted papers at ICML, NeurIPS, ICLR, CVPR, and AAAI since 2016, aggregating them into single-page views for about 1,260 topics, and extracted results tables and ablation data from 79,000 full texts. Each topic page shows a timeline of the best results on each benchmark and the corresponding papers, ablation experiments from recent papers (including failed attempts), common comparison baseline distributions, and the latest arXiv preprints and BibTeX, with every number linking back to the original text. The team explicitly states that data extraction is imperfect and that cross-paper numbers are not always comparable, positioning it as a research starting point rather than a leaderboard, and that data from 2026 papers has not yet been included. The tool is free and requires no registration, aiming to change the starting point of literature review.
Related articles

Altman Says Local Deployment Can't Beat Data Centers: The Open-Source AI Debate Reignites
Altman says local deployment of open-source models can't match centralized data-center computing. Bilibili creator Guashu Diluola breaks down the technical roadmap debate and China-US AI industry differences behind the remark, asking whether local deployment should really be abandoned.

MiniMax H3 Open-Source Workflow: Breathing-Skin Results Even on Low VRAM
This article introduces a MiniMax H3 dual-sampling workflow shared by a Bilibili creator, using fused models, a line-breaking LoRA, and low-VRAM nodes to fix greasy AI character faces and run on 12GB VRAM devices. Includes model pairing, dual-sampling logic, and parameter details.

On-Device LLM + ESP32: Build a DIY Calorie Reminder
A Bilibili creator open-sourced a calorie intake reminder: a phone app uses the open-source miniCPM model to locally recognize food photos and estimate calories, while an ESP32 mini screen syncs data and shows intake status with green/yellow/red rings — magnetically attachable to the fridge door for constant reminders.