12,000 Repos Reveal: No Middle Class in the MCP Ecosystem—Winner Takes All

Data from 12,000 repos shows the MCP ecosystem is extremely head-heavy: the median server has just 64 Stars and 70% of install paths are broken.
A full analysis of 5,945 MCP servers and 6,589 Agent Skill repos on GitHub shows an extreme winner-takes-all structure: the top 1% take 47.5% of server-side Stars and 41.7% of Skill-side Stars, with Gini coefficients of 0.867 and 0.882. 62.8% of servers have under 100 Stars (median 64), yet only 3.9% have zero Stars—the typical state is "in use but unstarred." Skills are more active overall (median 160 vs 64 Stars; 84.6% vs 64.2% pushed in six months). Licenses are mostly permissive, but 20–30% are missing one. Most practically: only 28.7% of servers have an extractable install command versus 100% for Skills, making fixed install docs the highest-leverage action.
12,000 Repos Reveal: No Middle Class in the MCP Ecosystem—Winner Takes All
If you thought the MCP (Model Context Protocol) ecosystem was a healthy "long-tail market"—a few star projects at the top, a solid middle tier, and a large base of small, elegant tools—then this full-dataset analysis of 12,534 deduplicated repositories will directly overturn that assumption.
The MCPMarkets team scraped 5,945 MCP servers and 6,589 Agent Skill repositories on GitHub (roughly 92% coverage) and ran a complete distribution analysis. The conclusion can be summed up in one sentence: an extremely high head, a tepid plain, and an abyss in between.
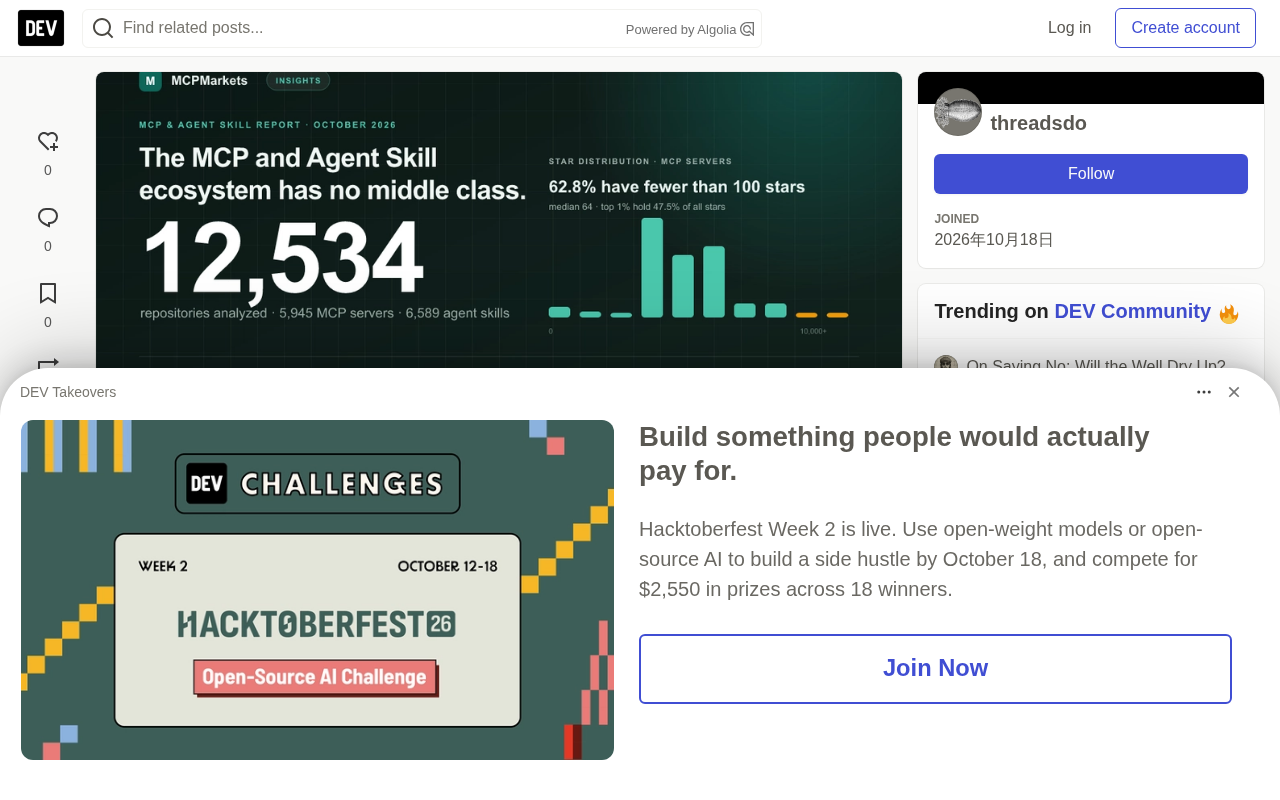
Here are the core numbers up front: the top 1% of repositories take 47.5% of all Stars on the server side (41.7% on the Skill side), and the top 10% together account for about 83%. 62.8% of MCP servers have fewer than 100 Stars, with a median of just 64. The Gini coefficient is 0.867 on the server side and 0.882 on the Skill side—wealth inequality close to the extreme.
The Head Is Narrower Than You Think
Most people's intuition about ecosystems is an "80/20 distribution," but the actual data is harsher than that.
The 5,945 server-side repositories have accumulated 3.21 million Stars in total. The percentiles look like this: p25 is just 36 Stars, the median is 64, p75 is 166, and p90 barely reaches 631. But at p99, the number jumps straight to 8,841—a 63x cliff. The mean-to-median ratio reaches 8.4x, which almost inevitably means a tiny number of extreme values are dominating the whole.
The Skill side's head is even more extreme. The largest repository in the entire catalog is a Skill project—openclawAd/openclaw with 392,124 Stars, four times the server side's top entry (punkpeye/awesome-mcp-servers, 96,415 Stars). The top ten Skill repositories together account for 15.6% of all Skill Stars.
There's a detail worth flagging here: the top-ranked awesome-mcp-servers is essentially an "awesome list," not an actual server implementation, yet it was classified as a server by keyword rules. On the other side, vinta/awesome-python (327,970 Stars) is the same story. The head is largely "attention aggregators," not "usable software."
There's also a thought-provoking finding: anthropics/skills has 181,394 Stars, but its license field is empty—the company that created the protocol has never set a license for its own official example repository.
Gini coefficient is a common metric for measuring the degree of inequality in a distribution, ranging from 0 to 1: 0 means perfect equality (every repository has the same number of Stars), and 1 means perfect concentration (all Stars concentrated in a single repository). In economics, above 0.4 is often considered high inequality, above 0.6 is a warning zone, and the 0.867 and 0.882 measured here are close to the theoretical extreme. To put it intuitively: if you randomly pick two repositories, the probability that their Star counts differ enormously is close to 90%. This is also why percentiles grow slowly up to p90 and then suddenly leap at p99—the mean is pulled up by a tiny number of super repositories while the median is almost unaffected, and the ratio between them (8.4x here) is the classic signature of this long-tail, heavy-tailed structure.
A Median of 64 Stars Is the Norm, Not a Failure
Spread out the Star histogram and you'll see an irregular "staircase": the 11–50 Star range holds 34.8% of repositories, the 101–500 Star range gathers 25.1%, while the 51–100 Star range in between actually shows a clear notch (21.9%), and above that is a deep four-digit trench.
93.1% of servers have fewer than 1,000 Stars. But note a counterintuitive number: only 3.9% of repositories have zero Stars. In other words, "nobody looks at it at all" is a minority case. The typical MCP server is "in use, but almost nobody stars it"—it's a live dependency for some team and completely invisible to everyone else.
The Skill side has the same distribution shape, shifted up one tier: 37.1% are below 100 Stars, 78.1% are below 1,000, and the median is 160.
For developers, a 40-Star project isn't a failure—it's a neighbor of the median. Treating Stars as an objective function in this ecosystem will lead to constant self-doubt.
Percentile is the value at a given percentage position after sorting all repositories by Star count from low to high. p25=36 means 25% of repositories have no more than 36 Stars; p50 is the median of 64; p90=631 means 90% of repositories have fewer than 631 Stars; and p99=8,841 is the threshold only the top 1% reach. Unlike the mean, percentiles aren't distorted by a few extreme values, making them better suited to describing this heavy-tailed distribution. The reason this article repeatedly cites percentiles rather than averages is precisely that in this ecosystem the "average Star count" is an almost nonexistent concept—it's been pulled to an unrepresentative height by a few head repositories.
Skills Are Hotter Than Servers, by No Small Margin
This is a direction the analysis hadn't anticipated: Skill repositories are clearly "hotter" than Server repositories.
- Median Stars: 160 vs 64, a 2.5x gap
- Total Stars: 14.17 million vs 3.21 million, 4.4x
- Pushed in the last six months: 84.6% vs 64.2%
- Dormant for 1–2 years: 20.4% on the Server side, almost zero on the Skill side
- The 10k-Star club: 256 Skills vs 54 Servers
Two explanations are likely both true. The barrier to writing a Skill is lower—a SKILL.md is itself the deliverable, with no protocol layer to implement; and Skills appeared later, just in time for the Agent narrative cycle.
The practical implication of this conclusion is a bit counterintuitive: the Server side looks less crowded, but its median survival environment is colder. If you're going to publish a Server, "continuous maintenance" alone is already differentiation—this becomes even clearer in the maintenance data below.
Licenses Aren't the Problem—The Absence of a License Is
The license distribution is surprisingly clean. On the server side, 58.4% are MIT, 13.5% are Apache-2.0, and permissive licenses (MIT/Apache/BSD/ISC/CC0/Unlicense, etc.) together account for 73.2%. Strongly viral AGPL plus GPL is only 5.0% combined. The Skill side is similar: MIT 53.5%, permissive 66.4% combined, and copyleft only 2.9%.
This is good news for users—closed-source use, commercial embedding, and redistribution basically won't hit a license wall.
The real risk lies in the gray zone: unlabeled plus NOASSERTION covers 21.8% on the server side and as much as 30.4% on the Skill side. "No license" means every user has to answer a legal question for themselves, and most people will get it wrong.
Permissive licenses (MIT, Apache-2.0, BSD, ISC, etc.) allow users to freely use, modify, distribute in closed source, and integrate commercially, usually only requiring preservation of the copyright notice; Apache-2.0 additionally includes a patent grant clause. Copyleft licenses (GPL, AGPL) require derivative works to be open-sourced under the same license, and AGPL's constraints even extend to providing services over a network, making it the least friendly for commercial embedding. NOASSERTION is a marker GitHub gives when it automatically identifies files in a repository, meaning "a license-related file was detected but it couldn't be matched to a standard license." Its legal meaning is as ambiguous as "unlabeled"—users can't determine from it whether they're authorized, which is trickier than an explicit prohibition.
Seventy Percent of Servers Have Broken Installation Paths
This finding comes from parsing READMEs. The team tried to extract, for each server, an executable installation command (in the form npx -y @modelcontextprotocol/server-xxx) and a ready-to-paste mcpServers JSON configuration:
- Only 28.7% of servers yield an executable installation command
- Only 34.5% include a usable configuration snippet
Simply put, more than seventy percent of MCP servers have broken installation paths. A reader finishes scrolling the README and still doesn't know which command to run—either it links back to the source repository, or buries the config in three hundred lines of prose, or mentions npm install and leaves it at that.
By contrast, the Skill side's installation command extraction rate is 100%, because the installation path is standardized as npx skillfish add owner/repo/path. One convention, zero ambiguity.
This is the cheapest advantage for maintainers: put the installation command and JSON configuration at the top of the README, each wrapped in its own code block. Ten minutes of work decides whether a user stays or bounces.
MCP (Model Context Protocol) is an open protocol that lets AI clients (such as Claude Desktop and various IDE plugins) call external tools and data in a unified way. An MCP server exposes its capabilities, and the client declares which server to connect to, what transport to use (stdio or HTTP), and what the launch command is via a mcpServers JSON configuration. The so-called "broken installation path" means the README has neither a directly executable launch command nor a JSON snippet that can be pasted straight into the client config file, leaving users to guess the package name, arguments, and transport themselves—and since the protocol has changed its config fields and transport methods more than once during its evolution, guessing wrong is costly. This is exactly why a unified convention (like Skill's fixed installation command) can significantly lower the adoption barrier.
One in Five Servers Is Already "Asleep"
Counting by the last upstream push time: 64.2% of servers have been updated within six months, 15.3% within 6–12 months, and another 20.4% haven't been touched in one to two years. On the Skill side, 84.6% are active within half a year, and the proportion dormant for one to two years is almost zero.
The problem is that MCP's client configuration format and transport methods have changed more than once during this window. A considerable share of dormant servers are actually "dead on arrival" out of the box, yet they still appear in directory listings, often near the top—because directories sort by Stars.
"Maintained" is a more useful filter dimension than "popular," and the display cost is minimal: just append the last push date next to each entry, and that's enough.
Three Practical Recommendations for Builders
Ordered by expected impact:
First, don't fixate on Stars. 62.8% of servers have fewer than 100 Stars, with a median of 64. A 40-Star server isn't a failure—it's the norm. Optimize for the one team that actually adopts it, not for the timeline.
Second, fix the installation command first. Seven out of ten repositories have broken installation commands. One copy-pasteable command plus a ready-made mcpServers configuration is the highest-leverage ten minutes in this ecosystem.
Third, merely staying maintained is enough. One in five server repositories is asleep. If you publish a server that actually runs and keep it usable, you're already in the top 20% for "still usable next quarter"—and you can prove it with commit dates.
Finally, a meta-lesson for data readers: the head is lists, the tail is the market. Much of the top layer sorted by Stars consists of aggregation lists and index projects (each side has two awesome-lists in its top five), and the supply of genuinely usable software is hidden in the 11–50 and 101–500 ranges, where nobody writes launch announcements.
The Boundaries of the Data Itself
This analysis has several limitations that must be stated plainly: classification is based on keyword heuristics, and some obvious list-type repositories were mixed in, which inflates the head figures but doesn't affect the shape of the tail; Stars measure exposure rather than usage, and the lack of npm/PyPI download data makes it impossible to distinguish "starred" from "used"; the snapshot covers about 92%, so absolute counts are conservative; and the taxonomy is still early, with 89% of server entries falling under a single category, "developer tools," so no category-level analysis was done.
All numbers can be reproduced from public directories. This is the first installment of a quarterly series; the next will focus on category-level analysis and trends in installation command coverage.
One-line Summary
Data from 12,000 repositories shows the MCP ecosystem is extremely head-heavy, with the median server at just 64 Stars and seventy percent of installation paths broken.
Paragraph Summary
A full analysis of 5,945 MCP servers and 6,589 Agent Skill repositories on GitHub shows the MCP ecosystem has an extreme winner-takes-all structure: the top 1% take 47.5% of Stars on the server side and 41.7% on the Skill side, with Gini coefficients of 0.867 and 0.882 respectively. 62.8% of servers have fewer than 100 Stars, with a median of just 64, yet only 3.9% have zero Stars—the typical state is "in use but unstarred." Skills are overall more active than Servers, with a median Star count of 160 vs 64 and a push rate in the last half year of 84.6% vs 64.2%. Licenses are mostly permissive, and the real risk is that two to three in ten repositories are missing a license. The most practical finding: only 28.7% of servers have an executable installation command extractable from their README, while the Skill side reaches 100% thanks to a unified convention—fixing installation instructions is the highest-leverage action in this ecosystem.
Related articles

Hands-On with the Gemini 4 Argon API: Thinking Levels and Background Mode Explained
A Free Code Camp crash course on the Gemini 4 Argon API: from getting a key and sending your first request to controlling reasoning costs with thinking levels, enabling multi-turn chat with previous_interaction_id, and generating a Breakout game in background mode—plus a Google engineer's take on the model's capabilities.

Reinforcement Learning Takes On Getting Over It: Distributed Training Strategies Behind 63% Progress
A developer uses deep reinforcement learning to tackle Getting Over It. The agent climbs from the bottom to 63% progress but gets stuck at the anvil. The project is open-sourced, using divide-and-conquer training and CPU-only training, seeking community collaboration to break the bottleneck.

Sigma FP2 Released: The World's Smallest Full-Frame Camera Gets Sensor and Screen Upgrades
Sigma launches the FP2 full-frame camera, retaining its smallest-and-lightest design with three key upgrades: improved sensor, articulating LCD screen, and longer battery life—built for portable video creators.