Agent Gateway Integrates Cloud Trace: End-to-End Tracing for AI Agent Requests

Google Cloud Agent Gateway integrates Cloud Trace to provide full end-to-end observability for AI Agent requests.
Slow AI Agents are notoriously hard to debug because the bottleneck could lie in the agent, the gateway, or an MCP server — and traditional approaches require piecing together multiple disconnected logs. Google Cloud's Agent Gateway now integrates with Cloud Trace (preview) to consolidate every hop of a request — agent, gateway, tool calls, and MCP servers — into a single, complete trace built on OpenTelemetry. Each gateway log is bidirectionally linked to its trace, enabling seamless navigation between high-level timelines and detailed log context. One critical setup requirement: the agent's service account must be granted the Cloud Trace Agent role, or the agent's own spans will vanish from the trace. This capability marks an important step toward making AI Agent systems truly production-ready and operationally maintainable.
When Your AI Agent Slows Down, Where's the Problem?
A slow-running AI Agent usually has three suspects: the agent itself, the gateway, or the MCP server. Without a unified tracing solution, diagnosing performance issues means jumping between three separate, disconnected logs — plus a lot of educated guessing. This fragmented troubleshooting approach is time-consuming and makes it nearly impossible to pinpoint the real bottleneck.
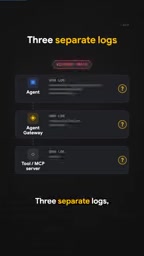
Google Cloud's Agent Gateway now integrates directly with Cloud Trace (currently in preview), addressing this pain point head-on. Its core value is simple: consolidate the complete lifecycle of a request into a single trace, making the otherwise opaque call chain in a distributed system fully transparent.
MCP (Model Context Protocol) is an open protocol proposed by Anthropic to standardize communication between AI models and external tools or data sources. It defines a common interface that allows AI Agents to invoke capabilities — such as file systems, databases, APIs, or code execution environments — in a consistent way, without needing to build a custom integration layer for each tool. An MCP server is a standalone service process that implements this protocol; agents communicate with it through an MCP client to access tool capabilities. This architecture offers the benefits of decoupling and reusability, but it also introduces additional network hops, making performance bottlenecks harder to isolate. A slow agent response could stem from processing latency inside the MCP server or from network transmission delays — without unified tracing, these are nearly impossible to distinguish quickly.
One Request, One Complete Trace
The integration logic between Agent Gateway and Cloud Trace is straightforward: once enabled, every request maps to a single, complete trace. Whether the request passes through the agent, the gateway, a tool call, or an MCP server, every hop is recorded on the same timeline.
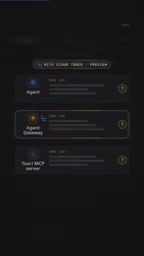
The most immediate benefit of this design is visibility: you can clearly see exactly where time is being spent. Is the gateway processing slowly, or is the destination service responding late? Questions that previously required stitching together multiple logs can now be answered from a single timeline.
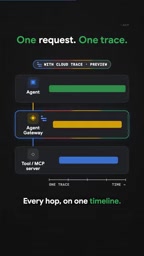
From an architectural perspective, this kind of end-to-end observability is especially critical for increasingly complex multi-agent systems. As AI Agents begin chaining together multiple tools and external services, call chains grow longer and any single point of latency can compound. Consolidating all hops into one trace essentially brings the mature practices of distributed tracing into the AI Agent runtime.
Standards-Based Observability with OpenTelemetry
Agent Gateway's tracing capability is built on OpenTelemetry. As the de facto observability standard in the cloud-native world, this means the tracing data is highly compatible and portable — developers aren't locked into a proprietary format.
On a more practical note, every gateway log is linked to its corresponding trace. This bidirectional connection between logs and traces allows you to freely switch between the "macro timeline" and "specific log details" during troubleshooting — once you spot an anomalous span, you can jump directly to the associated logs for context, forming a complete observability loop.
OpenTelemetry (OTel) is an open-source observability framework led by the CNCF (Cloud Native Computing Foundation), formed in 2019 from the merger of OpenCensus and OpenTracing. It provides a unified API, SDK, and data format for collecting three types of telemetry data: Traces, Metrics, and Logs. Trace data is composed of multiple spans: a span represents the time window of a single operation, and multiple spans form a tree structure through parent-child relationships, collectively making up a complete trace. Since major cloud providers including Google, Microsoft, and AWS all support OTel, tracing data built on it can naturally be exported to any compatible backend — Jaeger, Zipkin, Grafana Tempo, and others — avoiding vendor lock-in. For AI Agents, which cross multiple service boundaries, OTel's context propagation mechanism is key to enabling cross-service tracing: it injects a trace ID into request headers, ensuring that the same call chain is recognized as a single trace even as it traverses different services.
A Configuration Detail That's Easy to Overlook
There's one prerequisite that must not be missed during setup: you need to grant the Cloud Trace Agent role to the agent's service account.
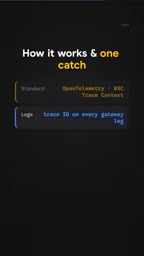
Skipping this step means the agent's own spans will disappear from the trace. In other words, you'll still see calls from the gateway and downstream services, but the agent itself will become an observability blind spot — and your end-to-end trace will no longer be complete. This permission configuration may seem like a minor detail, but it's the linchpin of the entire solution. Make sure it's in place before deploying.
Value and Use Cases
For teams building AI Agent applications, this capability transforms "guess-based troubleshooting" into "data-driven diagnosis." When agents, gateways, and MCP servers are chained together into complex pipelines, end-to-end tracing provides certainty — you no longer need to correlate timestamps across multiple logs. Instead, you get a single, clear call timeline.
It's worth noting that this feature is still in preview, meaning capabilities and the overall experience may continue to evolve. It's advisable to evaluate thoroughly before adopting it in production. That said, the direction is clear: bringing mature distributed tracing practices into the AI Agent runtime is an important step toward making agent systems more production-ready and operationally maintainable.
One agent request. One end-to-end trace. No more guessing.
Related articles

Chain of Thought Isn't Just for AI: How Humans Can Use CoT to Improve Thinking Quality
Chain of Thought isn't just a prompt trick for large models. Starting from a Hacker News discussion, this article analyzes why CoT works for human thinking too, breaks down actionable ways to transfer it, and highlights the key differences between human CoT and machine CoT.
Cloudflare Teams Up with OpenAI: Closi…
Cloudflare Teams Up with OpenAI: Closing the Loop from Vulnerability Discovery to Defense with AI
Cloudflare uses OpenAI Daybreak to investigate security vulnerabilities and generate reviewable remediation plans, while developers use Codex to boost coding efficiency and quality.

Orca Multi-Agent Orchestration in Practice: A Guide to Parallel Collaboration with Claude and Codex
Orca is Stable AI's free open-source agent workbench supporting 34 agents like Claude Code and Codex in parallel. Learn its Git worktree isolation, multi-model orchestration, and mobile management.