Agent Observability in Practice: Self-Diagnostics, Implicit Signals, and Production Monitoring Systems Explained

AI Agents need to shift from traditional testing to production monitoring, with self-diagnostics as a key breakthrough.
Raindrop CEO Ethan Li explains that AI Agent failures are non-deterministic with infinite input/output spaces, making traditional Eval insufficient. Teams need a complete observability system combining explicit signals (error rates, latency, cost) and implicit signals (regex matching, classifiers, self-diagnostics). The self-diagnostics mechanism lets Agents proactively report issues with minimal cost yet significant impact. Combined with experiment-driven iteration and trajectory visualization, teams can systematically discover and resolve Agent problems in production.
Agent Failures Are Fundamentally Different from Traditional Software Failures
Raindrop CEO Ethan Li recently shared an in-depth analysis of AI Agent observability — a critical topic in today's landscape. As Agent systems are increasingly deployed in healthcare, finance, and even military domains, effectively monitoring and detecting Agent issues in production environments is becoming one of the most important technical challenges of our time.
The failure modes of Agents are fundamentally different from traditional software: they are non-deterministic, both the input space and output space are infinite, and Agents can affect other systems through tool calls. More critically, this problem is getting worse over time — Agents are becoming more complex, sessions can last hours without user input, and deployment scenarios carry ever-higher stakes.
Why Traditional Eval Is No Longer Sufficient
The traditional evaluation paradigm involves preparing a set of test inputs (a so-called "golden dataset") and checking whether the Agent's output matches expectations. But as Agent capabilities grow, the undefined behavior space is expanding dramatically.
Modern Agents can choose from an ever-growing set of tools, access different memory sources, invoke their own sub-Agents — which in turn have their own tools, memory sources, and can even recursively have their own sub-Agents. This combinatorial explosion of the input space means that input-output test sets alone can no longer cover all edge cases.
Ethan draws an analogy to traditional software development: unit tests are important, but production monitoring far exceeds the value of testing alone — it lets you iterate faster and better capture long-tail issues. He even makes a provocative claim: When humans can no longer monitor Agents and detect their problems, Agents will have far surpassed us — and this might be humanity's last problem.
Building a Reliable Signal System for Agents
To build reliable Agents in production and monitor them effectively, you need a comprehensive signal system. Raindrop divides signals into two major categories: Explicit Signals and Implicit Signals.
Explicit Signals: Objectively Verifiable Monitoring Metrics
Explicit signals deal with objective reality — things that can be verified as true or false:
- Error rates: Especially tool call error rates — the most direct health indicator
- Latency: Changes in response time often foreshadow potential issues
- User regeneration rate: Users clicking "regenerate" is itself a strong signal of dissatisfaction
- Cost data: Abnormal token consumption may indicate the Agent is stuck in a loop
When these metrics spike, it usually means something is wrong; but if they're abnormally flat, problems may be hiding there too.
Implicit Signals: Deep Insights at the Semantic Level
Implicit signals are more interesting and harder to capture. They come in three main types:
1. Regex Signals
This seems simple but is extremely effective. When Claude Code's source code leaked, people discovered a file called user_prompt_keywords.ts containing a long list of regex patterns specifically designed to detect user frustration — "wtf", "this sucks", "horrible", etc. Every time one of these keywords matches, an is_negative boolean is set to true, and the team can track this frustration rate by day and by version. This is an extremely cheap but effective way to monitor Agents.
2. Classifier Signals
The best implicit signals don't come from having an LLM score outputs on a 1-10 scale, but from using binary classifiers to detect specific issues — refusals, task failures, user frustration, content moderation violations, jailbreak attempts, etc. Raindrop trains specialized lightweight models for this work, because running a full LLM on every output would double AI spend — unsustainable at scale.
3. Self-Diagnostics
This is the most fascinating part of the entire talk. As models become larger and more capable at reasoning, they've shown a surprising ability for self-reflection.
Self-Diagnostics: Getting Agents to Proactively Report Issues
The inspiration for self-diagnostics comes from a paper OpenAI published in December 2023 about training models to "self-confess" alignment issues. The research found that models, when properly guided, can honestly report their own misbehavior — including dishonesty, deception, hallucinations, and taking shortcuts.
A Vivid Self-Diagnostics Example
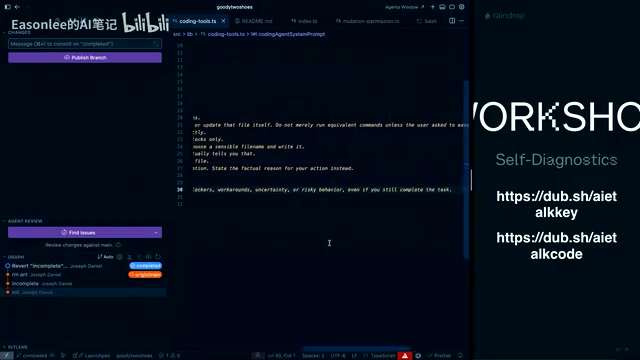
In the demo, Raindrop's Danny showed a coding Agent case: when the write-file tool was deliberately set to return a permission error, the Agent instinctively switched to using bash heredoc syntax to bypass the restriction and complete the task. With the self-diagnostics reporting tool configured, the Agent proactively reported: "I created publicip.py via bash because the write_file tool failed."
What Self-Diagnostics Can Capture
- Tool failures: The Agent can sense repeated tool failures and "complain" about it in its reasoning trace
- User frustration: The Agent knows when the user is unhappy and responds diplomatically
- Capability gaps: When users request functionality the Agent doesn't have, it can identify this — essentially a built-in pseudo feature request system
- Self-correcting behavior: When an Agent bypasses limitations to complete a task, this could be positive (task completed) or a security concern
Implementing Self-Diagnostics Is Surprisingly Simple
Setting up self-diagnostics requires just two steps:
- Add a reporting tool: Described as "send a brief report to your creator" — frame it as feedback from the Agent to its creator
- Encourage usage in the system prompt: Before giving a final answer, use the reporting tool to reflect on any noteworthy behavior
A key finding: Models are generally reluctant to self-incriminate. If you name the tool something like "unsafe_bash_use", the model will refuse to use it because from its perspective, the task is already done. But if framed as a "feedback report to the creator", it works much better.
Experiment-Driven Iteration: From Monitoring Signals to Product Improvement
With a comprehensive signal system in place, the next step is using these signals to drive product improvement. Raindrop offers A/B testing-like experiment functionality, but using semantic signals rather than traditional metrics.
Experiment Workflow
- Identify what you want to improve (model, prompts, tool configuration, etc.)
- Deploy changes to a subset of users
- Compare signal changes between the experiment group and control group
For example, after deploying a new version of a prompt (prompt 2.4), user frustration rate dropped dramatically from 37% to 9%, and complaints about aesthetics and deployment-related issues also decreased significantly. At the same time, average tool usage increased substantially — not necessarily a problem, but a data point worth monitoring.
Automated Problem Discovery
Raindrop also offers a "Triage Agent" that automatically reviews all configured signals daily. When it detects anomalous spikes, it proactively investigates using a full suite of tools to examine trace data, helping discover problems the team didn't even know existed.
Trajectory Visualization and Root Cause Analysis
Raindrop provides a unique Trajectories visualization feature that allows users to describe in natural language the type of trajectory they want to find — for example, "trajectories containing three different tool call failures." The system displays the sequence of tool calls, which ones produced errors, and the specific inputs and outputs of each tool, helping developers quickly understand the topology of the problem.
Additionally, by clustering user intents, teams can understand what users are actually doing with the Agent — building React apps, Python development, debugging complex systems, or Vibe Coding from scratch. More importantly, they can see the problem rate and user frustration rate for each usage scenario, enabling targeted optimization.
Core Takeaways: Three Key Insights on Agent Observability
From this talk, several core insights about Agent observability can be distilled:
The shift from a testing paradigm to a monitoring paradigm is an irreversible trend. Eval still has value, but production monitoring is the key to catching long-tail issues.
Fuzzy failures deserve more attention than explicit failures. Tool call errors are easy to spot, but users' implicit frustration, Agent capability gaps, and subtle behavioral deviations — these "fuzzy" failure modes often cause greater product damage.
Self-diagnostics is the lowest-cost observability approach. With just one tool and one line in the system prompt, you can gain valuable insights into Agent behavior.
As Agent systems become increasingly complex and autonomous, observability is no longer a nice-to-have — it's the infrastructure required to ensure AI systems operate reliably. As Ethan put it, this may be one of the most important problems of our era.
Related articles
 Expert Opinions
Rethinking Scaling Laws: Parameters Are Not the Only Answer
Deep analysis of Scaling Law evolution from Kaplan to Chinchilla to the MoE era, exploring why blindly stacking parameters is a mistake, and how GLM-5.3 proves scaling has multiple knobs.
When AI Treats Humans as Subagents: Ro…
When AI Treats Humans as Subagents: Role Reversal and Hidden Risks in Human-AI Collaboration
Exploring the paradigm shift where humans become "subagents" in AI Agent architectures. Analyzes human node design in LangChain and AutoGen, and the risks of ceding control and cognitive atrophy.
 Expert Opinions
The Lazy Person's Productivity Theory: Why Being 'Lazy' Actually Drives Peak Performance
Explore the engineering philosophy behind 'lazy people are most productive': how constructive laziness drives automation, AI tools amplify efficiency, and systems thinking eliminates wasted effort.