AI Modeling of the Hoover Dam: From Map Selection to a Trustworthy Visualization Verification Workflow

AI-generated 3D scenes serve only as contextual reference and must be strictly separated from engineering records via a five-step verification workflow.
The article presents a developer's practice of using Shapezo for AI modeling of the Hoover Dam, arguing that AI-generated 3D scenes are contextual reference rather than engineering records. The five-step verification workflow includes: clarifying the question and scope while saving extent, date, and purpose; layer management with confidence annotation to distinguish confirmed geometry from speculation; verifying scale, orientation, units, and coordinate assumptions; using cutaway views to show the water-to-power path without fabricating equipment states; and attaching a complete provenance chain when exporting to prevent distortion. Version management is also required. The core value is that generated content supports understanding while engineering data supports decisions, and the two must not be confused—applicable to any AI geospatial visualization project.
Treating a generated 3D scene as an engineering record is the easiest trap to fall into with AI modeling. A developer shared on Dev.to his approach to visualizing the Hoover Dam: using Shapezo to select an area on a map and letting AI generate the model, but strictly separating "looks precise" from "actually reliable" through a five-step verification workflow.
The Core Conflict: Generation Precision Is Not Engineering Credibility
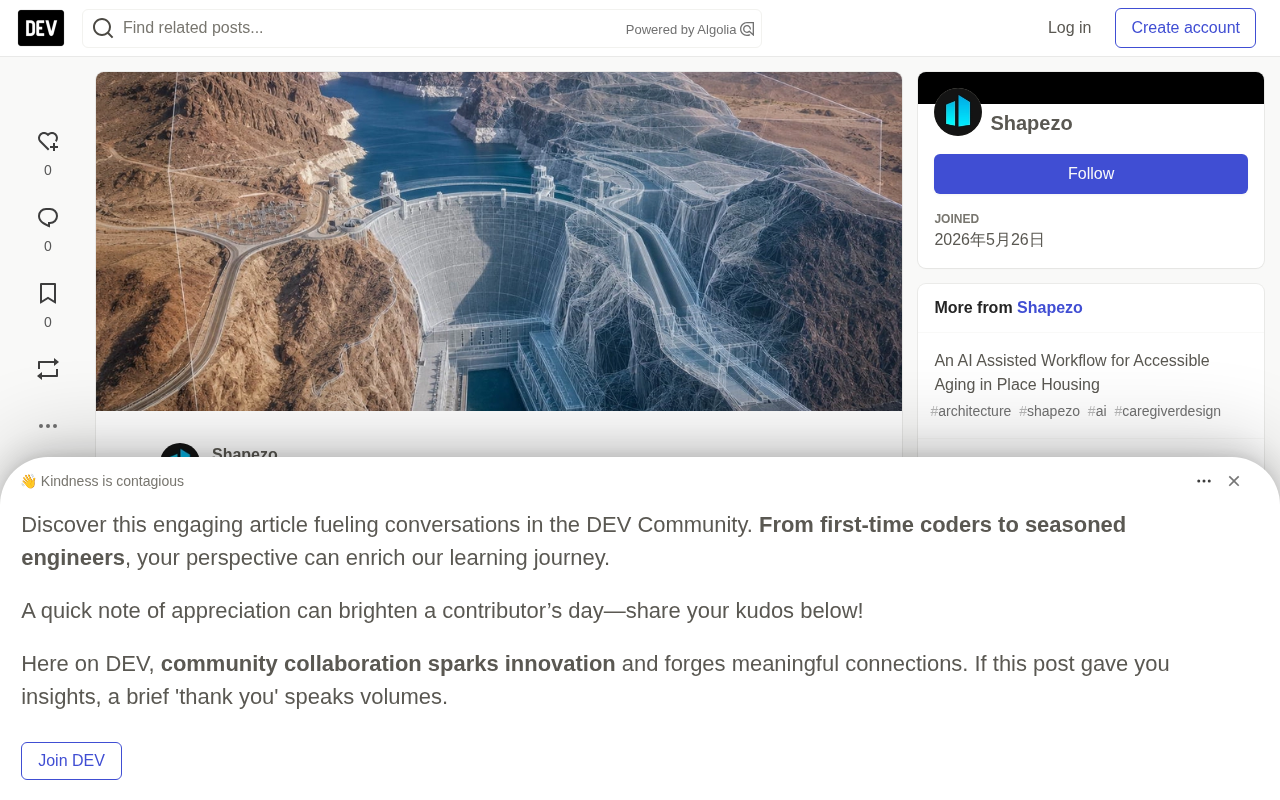
The Hoover Dam is not just a landmark. It simultaneously contains the concrete dam body, Lake Mead reservoir, intake towers, penstocks, power plant, spillways, roads and bridges, and steep desert canyon terrain. If these elements appear equally detailed in a model, viewers can easily assume it is an engineering archive.
The problem is that what AI generates is only contextual reference, not survey data or a digital twin. The author's approach: generated content can help understand spatial relationships, but must never serve as the basis for engineering decisions. This boundary must be drawn clearly from the very start of modeling.
Digital Twin is the key reference for understanding this conflict. It refers to a high-fidelity dynamic mapping of a physical entity in digital space, typically driven by measured data, capable of reflecting the entity's state in real time and supporting simulation and prediction. A qualified digital twin requires support from multi-source authoritative data such as survey control data, sensor readings, and operational records, and both its geometric precision and semantic information have traceable sources. An AI-generated 3D model, by contrast, is essentially a visual approximation inferred from images or text prompts—it reproduces a form that "looks like" the real thing, not a measured and verified real structure. The most fundamental difference between the two is this: every element of a digital twin can be traced back to a data source, whereas an AI model cannot provide evidence for each of its vertices. Therefore, in engineering scenarios like the Hoover Dam, using an AI model as a digital twin amounts to treating speculation as fact—which is precisely why the author repeatedly emphasizes boundaries.
Step One: Define the Question First, Then the Scope
The starting point of modeling is not opening a tool, but clarifying a specific question: am I trying to explain the relationship between the reservoir and the dam body, or the power plant, the spillway, or the road crossing?
The choice of boundary scope directly affects the model's validity. If the scope is too small, the dam becomes a small, hard-to-recognize object in the frame; if too large, the terrain and water dilute the core information. The author saves the map extent, generation date, and intended use together with the file—these three pieces of information are crucial for later credibility judgments.
Step Two: Manage in Layers, Annotate Confidence
This is the most critical step in the entire workflow. Terrain, reservoir water body, dam body geometry, intake structures, power facilities, roads, and schematic internal equipment are all placed in independent layers.
Each layer carries a source description and confidence status. Known dam outlines and speculated service tunnels cannot be presented in the same visual manner. The reason is straightforward: repeated structural details, even if only approximations, create an illusion of "authority." Layering is not for aesthetics—it is to let viewers distinguish what is confirmed from what is inferred.
Layers and Confidence Annotation in GIS is a foundational practice in geographic information science. In professional GIS workflows, each layer typically carries metadata including data source, collection time, accuracy level, and coordinate system. Common practices for confidence annotation include distinguishing by line style (solid lines for confirmed, dashed for speculated), by transparency (high transparency for low confidence), or by attaching attribute fields to record uncertainty ranges. The value of this method lies in turning "uncertainty" from an implicit assumption into explicit information, so that any viewer can tell at a glance which geometries are reliable. AI modeling tools often default to giving all generated content equal visual weight—and that is precisely the risk: when confirmed outlines and speculated tunnels are rendered in the same way, viewers unconsciously grant the speculated parts the same authority. Layered management and confidence annotation are, in essence, bringing the professional discipline of the GIS field into the AI generation workflow.
Step Three: Verify Proportions and Spatial Relationships
Before publishing the scene, the canyon morphology, dam crest alignment, bridge positions, intake tower and power plant locations need to be compared one by one against reliable maps. Check items include orientation, units, coordinate assumptions, and relative elevations.
Common anomaly signals include: reservoir shoreline too smooth, canyon walls flattened, penstock endpoint positions incorrect. These details are often hard to notice in a single view, but they seriously undermine the model's spatial credibility.
If the purpose is technical review, verification requirements escalate further. Conclusions involving dam condition or performance require survey control data, structural drawings, hydrological data, inspection records, and operator information. An AI model can mark where the problem is, but it cannot answer the question itself. This boundary must be emphasized repeatedly.
Survey Control Data and Coordinate Assumptions are core concepts in the verification step. Survey control data refers to known precise coordinate points (control points) established through geodetic surveying methods—they are the benchmark for all spatial data. In a 3D scene, if the model is not bound to a real coordinate system, its orientation, distances, and relative elevations may have systematic biases. Common coordinate assumption problems include: defaulting to WGS84 but actually mixing in a local coordinate system, inconsistent elevation datums (e.g., confusing altitude above sea level with ellipsoidal height), and units not clearly labeled between meters and feet. These biases are often masked by perspective effects during single-view browsing, but are exposed when overlaying layers or comparing with authoritative maps. Therefore, the "coordinate assumptions" the author emphasizes are not optional annotations—they are prerequisites that determine whether the model can align with external data.
Step Four: Make the Water-to-Electricity Path Readable
The most valuable aspect of the model is its ability to clearly show a sequence: impoundment, intake, penstocks, turbines, generators, transformers, downstream release. The author uses cutaway or internal views to show the penstocks and generator hall, but strictly avoids fabricating equipment labels, unit status, or maintenance activities. Generic equipment must remain clearly schematic.
The spillway follows the same discipline. Its form and relationship to the reservoir can be shown, but it cannot be claimed that a release is occurring—that depends on weather, reservoir level, and dispatch rules, which the model is incapable of expressing.
Step Five: Preserve the Provenance Chain
When exporting images or models, attach the selected boundary, data sources, date, coordinate assumptions, and intended use. The contextual data generated by Shapezo must remain separated from authoritative engineering data.
The significance of this step is preventing distortion through reuse. A screenshot without a source list may be given a completely different meaning in subsequent circulation—this is one of the most insidious risks of AI-generated visualization content.
Provenance Chain is a mature concept in data governance and scientific visualization, referring to the complete traceable path from raw data to final presentation. In the context of AI-generated content, the provenance chain needs to record: which AI tool and version was used, what prompts or boundary conditions were input, the generation date, whether subsequent manual editing occurred, and what was edited. Visualization content lacking a provenance chain undergoes "context stripping" during circulation—after a screenshot is forwarded separately, the recipient cannot tell whether it is a schematic or a measured image, and may thus assign it a completely different meaning. This is not a theoretical risk; there have been multiple cases in social media and news reporting where AI-generated images were mistaken for real photographs or authoritative charts. Practical ways to preserve the provenance chain include: embedding metadata in the exported file, and adding a brief watermark annotation at the image edge indicating the generation tool, date, and usage restrictions.
Version Management: A Practical Rule
When boundaries or source data change, retain versions. One version may serve as a public discussion overview, another may focus on the power plant or spillway corridor. Version names, dates, and source annotations prevent later readers from mistakenly assuming all views describe the same state.
The author's summary is clear: Shapezo shortens the path from "where is the dam" to "how the dam, canyon, reservoir, and power plant relate." This value is especially evident for the Hoover Dam, because true scale is hard to read from a single viewpoint. Verification keeps the model honest—generated context supports understanding, engineering records support decisions, and the two must not be confused.
This workflow applies not only to dams. Any AI-generated geospatial visualization—whether infrastructure, urban planning, or terrain analysis—faces the same credibility challenge. Layering, annotation, verification, and provenance preservation: these four things constitute the basic threshold for AI visualization to move from "good-looking" to "usable."
One-line Summary
AI-generated 3D scenes can only serve as contextual reference and must be strictly separated from engineering records through a five-step verification workflow.
Paragraph Summary
The article presents a developer's practice of using Shapezo for AI modeling of the Hoover Dam, with the core argument that AI-generated 3D scenes are contextual reference rather than engineering records. The author proposes a five-step verification workflow: first clarify the question and scope and save the extent, date, and purpose; manage in layers and annotate the confidence of each layer, distinguishing confirmed geometry from speculated structures; verify proportions, orientation, units, and coordinate assumptions, identifying anomaly signals such as overly smooth shorelines; use cutaway views to show the water-to-electricity path while strictly prohibiting fabricated equipment status; and attach a complete provenance chain when exporting to prevent distortion through reuse. In addition, version management must be retained. The core value of this workflow is that generated content supports understanding, engineering data supports decisions, and the two must not be confused—applicable to any AI geospatial visualization project.
Related articles

JobRunner MCP Server: AI Agents Can Now Fix Failed Java Jobs
JobRunner launches an open-source MCP server enabling AI agents to view cluster status, diagnose failures, and recover Java jobs—incident response from any cloud coding environment or existing agent.

MLAI Digital Launches 9 Security Agents: MCP Server Safeguards the Full Lifecycle of Agentic AI
MLAI Digital launches Security MCP Server with nine built-in specialized security agents covering vulnerability discovery, attack simulation, prompt injection detection, API and infrastructure assessment, and accelerated remediation—embedding security validation across the full Agentic AI lifecycle from development to production.

Running Isaac Lab on H100 GPUs: Exploring Better Approaches
Exploring optimization methods for running Isaac Lab on NVIDIA H100 GPUs, including MIG configuration, mixed precision, TensorRT acceleration, and community experience to improve robotics simulation and reinforcement learning efficiency.