AI Trading Bot Free Trial Checklist: Features to Verify Before You Start

Beginners should prioritize risk controls, backtesting, transparency, and security over returns before trying AI trading platforms.
This article offers a systematic evaluation framework for beginners on AI trading platforms. The core message: automation improves execution discipline but doesn't guarantee profits. It covers backtesting traps like overfitting and ignored costs, emphasizes risk-adjusted metrics over raw returns, explores AI's real capability boundaries, and highlights API security, copy trading limitations, six common mistakes, and a step-by-step evaluation framework.
Many AI trading platforms advertise automation, artificial intelligence, and impressive historical returns, but marketing language and what you actually need often diverge sharply. Before signing up for a free trial, beginners should focus on risk controls, backtesting methodology, transparency, execution reliability, and security — these are what ultimately determine whether you learn or lose money.
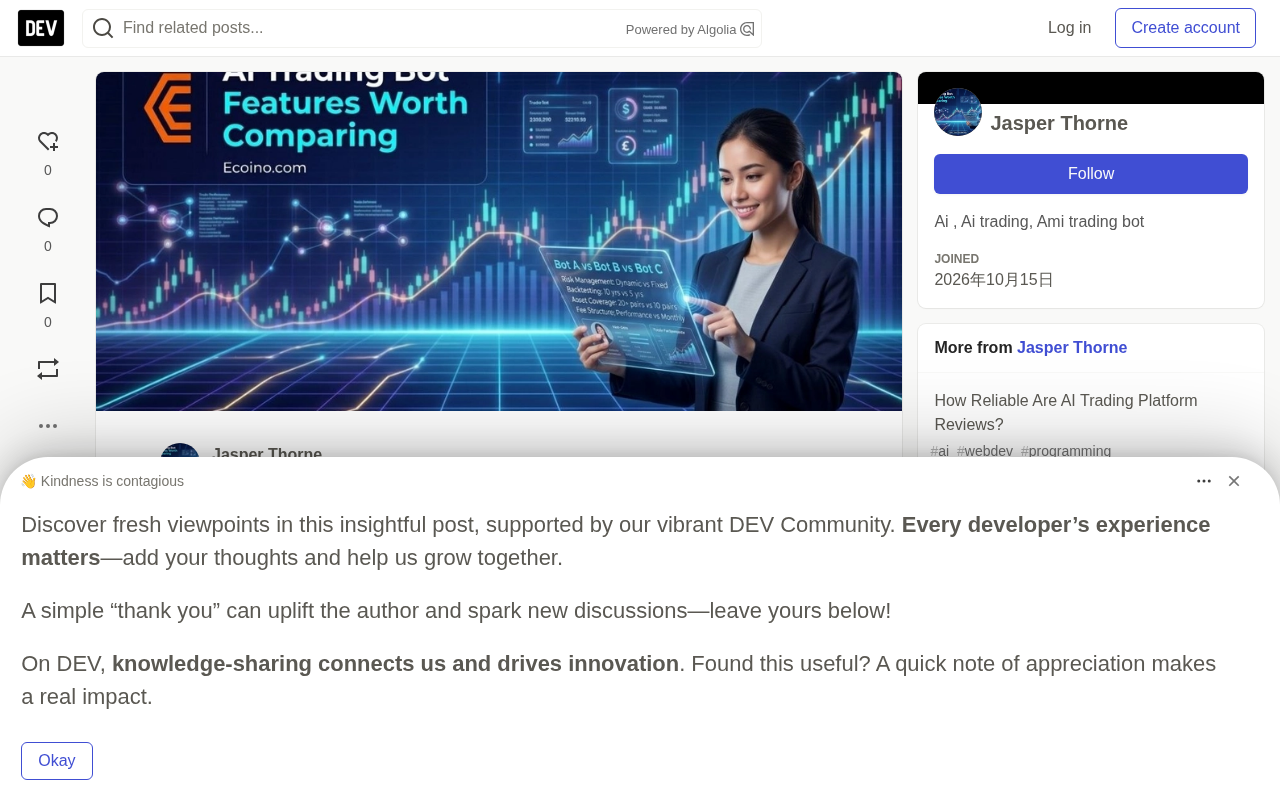
Why Do Your Homework Before a Free Trial
Automation solves a very practical problem: discipline. Bots can continuously monitor prices, volatility, and position exposure without fatigue or emotional swings, and execute orders quickly when conditions are met. But automation alone doesn't make a strategy profitable.
It's better to think of automation as a tool for improving process discipline and execution efficiency. A strategy can execute fully automatically and still lose money consistently. Before clicking "Start Free Trial," beginners need to figure out what the platform actually offers — and what it's missing.
Backtesting: The Feature Most Likely to Mislead You
Backtesting is the process of evaluating a trading strategy using historical data. A typical workflow: select an asset or market, choose a historical time period, apply strategy rules, simulate historical trades, and analyze the results. Results usually include metrics such as historical returns, maximum drawdown, win rate, number of trades, average per trade, volatility, and profit factor.
A Good Backtest Doesn't Mean Future Profits
A successful backtest doesn't prove future profitability. A strategy may be over-optimized to historical data — that is, "overfitted." Imagine a strategy that performs extremely well over a certain five-year period — if the parameters were repeatedly tuned until that period produced outstanding results, it may simply have been perfectly fitted to the past.
Overfitting is one of the most insidious and dangerous traps in quantitative trading. From a statistical perspective, when the number of model parameters is too large relative to the amount of available data, the model begins to fit random noise in the data rather than genuine patterns. A classic example: a high-degree polynomial curve can perfectly pass through any number of points on a plane, but using it to predict new data points is meaningless. In trading strategies, overfitting manifests as an extremely smooth and beautiful historical backtest curve that quickly loses money once it goes live. Several signals for identifying overfitting include: the more strategy parameters the better, backtest results being extremely sensitive to small parameter changes, strategy performance dropping off a cliff in out-of-sample testing, and too few trades leading to insufficient statistical significance. Defensive measures include limiting the number of parameters, using cross-validation, insisting on out-of-sample testing, and remaining skeptical of any "perfect" backtest results.
Out-of-Sample Testing and Walk-Forward Analysis
A stronger approach is to split historical data into different periods: one for development and another held back for validation. This better indicates whether a strategy has generalization ability. Walk-forward analysis goes further, repeatedly training the strategy on one historical window and then testing it on the subsequent period, helping identify strategies that are more stable across different market environments.
Walk-Forward Analysis is widely recognized in quantitative trading as the validation method closest to live trading. Its core idea is to simulate how a strategy would be deployed on a real timeline: first train strategy parameters on data from years 1-2, then simulate trading on year 3 data; next, slide the window forward, train on years 2-3, trade on year 4, and so on. This rolling approach tests the strategy's adaptability and stability across different market environments. Compared to simple out-of-sample testing, the advantage of walk-forward analysis is that it produces multiple independent test segments, allowing you to observe the consistency of strategy performance rather than just a single test period. Walk-Forward Efficiency is a commonly used metric that calculates the ratio of out-of-sample performance to in-sample performance — if this ratio is far below 1, it indicates severe overfitting. For ordinary investors, even if they don't run walk-forward analysis themselves, they should ask whether a platform's backtesting tools support this type of methodology when evaluating it.
Don't Forget Trading Costs
Backtests that ignore commissions, spreads, slippage, and other costs produce unrealistic results. Always ask the platform: does the historical simulation include realistic trading assumptions?
Transparency and Performance Reporting: Don't Just Look at Returns
Beginners shouldn't have to guess what a trading bot is doing. Transparency means the platform provides enough information to understand strategy activity, results, and risk. Useful reporting should include: entry and exit history, current positions, realized P&L, unrealized P&L, drawdown, trade frequency, strategy allocation, historical performance, fees, and account exposure.
Why Raw Returns Aren't Enough
Suppose Strategy A returns 15% and Strategy B returns 12%. At first glance, A looks better. But what if A experienced a 35% drawdown while B only had 10%? For beginners with limited drawdown tolerance, this difference matters far more than the 3-percentage-point return gap.
Experienced traders typically examine risk-adjusted metrics such as the Sharpe ratio, Sortino ratio, maximum drawdown, and profit factor together. These metrics should not be interpreted in isolation.
A credible platform should let you inspect actual trading activity, not just display a flashy return percentage. This allows users to judge whether results come from frequent small trades, occasional large positions, or something else entirely.
The Sharpe ratio, proposed by Nobel laureate William Sharpe, measures the excess return earned per unit of total volatility, calculated as (strategy return − risk-free rate) / standard deviation of returns. Generally, a Sharpe ratio above 1 is considered acceptable, and above 2 is excellent, but note its limitations: it assumes returns follow a normal distribution and treats upside and downside volatility equally. The Sortino ratio improves on this by using only downside deviation as the denominator, better aligning with investors' genuine concern about "losing volatility." Maximum drawdown measures the largest decline from a historical peak to trough, directly reflecting the worst-case capital shrinkage — particularly important for beginners, since a strategy with 50% maximum drawdown means you need a 100% gain to break even. Profit factor is total profits divided by total losses; above 1 means overall profitable, and below 1.5 is generally considered insufficiently robust. Each of these metrics emphasizes something different, and looking at any one in isolation can lead to misjudgment — they should be used in combination and interpreted alongside strategy type and market environment.
AI Market Analysis: Capabilities and Boundaries
AI trading systems can process vast amounts of information and identify patterns that are hard to monitor manually. On the technical analysis side, AI systems may analyze price movements, trading volume, volatility, momentum, moving averages, market structure, and combinations of technical indicators.
For sentiment analysis, some systems attempt to analyze market sentiment from news, public discussions, and other sources. Sentiment analysis can provide additional context but should not be treated as a direct predictor of price movements — market sentiment can shift rapidly.
Pattern recognition is another core capability. Machine learning models can identify statistical relationships in historical data. The key question is: do these relationships still hold when conditions change? Patterns found in one market environment may disappear after changes in volatility, liquidity, regulation, or investor behavior.
AI Is Not the Same as Autonomous Intelligence
Marketing language can make AI systems sound almost infallible. In reality, AI models operate within constraints set by training data, model architecture, data quality, market conditions, and execution systems. A model can be technically advanced and still produce terrible trading decisions.
When a platform claims to use AI, you should ask: what data does the model analyze? How are predictions evaluated? Can users see the strategy logic or relevant performance evidence? How does the system behave under abnormal market conditions? Concrete answers are more meaningful than broad AI terminology.
Most of what is currently called "AI trading" technically falls under the category of machine learning rather than general artificial intelligence. Specifically, common techniques include: supervised learning (training models on historical data to predict price direction), reinforcement learning (letting agents learn trading strategies through trial and error in simulated markets), natural language processing (analyzing news and social media sentiment), and deep learning (using neural networks to identify complex patterns). Each technique has clear boundaries of applicability and failure modes: supervised learning depends on the repeatability of historical patterns and fails when markets undergo structural changes; reinforcement learning tends to overfit in simulated environments, and the design of the "reward function" itself can introduce bias; NLP sentiment analysis often misinterprets sarcasm, context, and sudden events. Moreover, data quality is a key factor determining AI system performance — garbage in, garbage out. Understanding these technical boundaries helps investors ask more targeted questions when they hear "AI-powered" marketing claims.
Automation and Trade Execution
A typical automated workflow: monitor market conditions, strategy identifies qualifying signals, check risk rules, generate orders, send to trading venue, record trades, update portfolio exposure. Each step can introduce potential failure points.
Execution speed can matter in highly volatile markets, but faster doesn't automatically mean better. Poorly configured high-frequency strategies can generate excessive trading costs and unnecessary exposure. Slippage occurs when the actual execution price differs from the expected price, and becomes more pronounced during rapid market moves or when liquidity is limited.
Reliability becomes important when automation depends on exchange APIs or external connections. Beginners should understand: what permissions are requested? Is withdrawal permission required? How are credentials protected? What happens when the connection fails? Can users revoke access?
When connecting a trading platform to an exchange, grant only the permissions needed for the intended functionality. Avoid unnecessary account permissions whenever possible.
Social Intelligence and Copy Trading
Copy trading allows investors to replicate the selected trading activity of another trader or strategy. The specific mechanics vary by platform — some systems automatically copy trades, while others provide signals for users to review.
Beginners may not yet know how to build a complete trading strategy. Following experienced traders can provide exposure to strategy selection, market timing, asset allocation, risk management behavior, and portfolio construction. But copying someone else's trades doesn't transfer their expertise to the investor.
Performance Still Needs Investigation
A trader with recent outstanding performance may have taken on abnormally high risk. Before following, you need to check: historical consistency, drawdown, trade frequency, asset exposure, risk profile, length of track record, and the market conditions during the reported performance period.
If two traders generate similar returns, study how they achieved them. A strategy with moderate returns and controlled drawdown may offer a more sustainable learning opportunity than an aggressive strategy that achieved flashy returns through extreme risk.
Take ecoino.com as an example — its positioning centers on social intelligence and copy trading, offering a more interactive approach than running isolated automated algorithms. Users can learn in an environment of strategy discovery and trader comparison, rather than treating automated trading as a black box. But regardless of the approach, automation cannot eliminate investment risk.
Six Common Mistakes Beginners Make
Chasing the highest returns. The flashiest performance numbers are often the most tempting, but in isolation they're also one of the least useful pieces of information. Two strategies can generate identical returns while taking on vastly different levels of risk.
Believing AI guarantees profits. Artificial intelligence is a technology, not a guarantee. Bots can lose money because market conditions change, data is incomplete, predictions are wrong, liquidity disappears, execution deviates from expectations, or the strategy becomes crowded.
Ignoring fees. Trading costs can significantly impact performance. Fees to watch include trading commissions, spreads, funding costs, withdrawal fees, platform fees, performance fees, and slippage.
Over-automating too quickly. Beginners may activate multiple strategies simultaneously without understanding how they interact. Start with one clearly understood strategy, monitor it, learn its behavior, then consider expanding.
Copy trading without research. A trader's past success may reflect a specific market cycle. Before copying, investigate track record length, maximum drawdown, risk level, asset concentration, trade frequency, and strategy consistency.
Neglecting account security. Use strong passwords, enable multi-factor authentication, review connected apps, limit unnecessary API permissions, monitor account activity, and avoid sharing credentials. Security should be an ongoing process.
A Step-by-Step Framework for Comparing Platforms
When choosing software, a consistent evaluation process makes decisions easier:
- Define your goals — do you need portfolio monitoring, automated execution, copy trading, strategy testing, technical analysis, or risk management?
- Identify your risk tolerance — a strategy that looks appealing on paper may not suit your financial situation.
- Compare security controls — evaluate security before convenience.
- Test the interface — can you find your positions? Can you understand your exposure? Can you turn off automation?
- Review historical evidence — examine backtesting methodology, live performance history, drawdowns, and trading activity.
- Start with simulation — use a demo account or risk-free testing methods.
- Start with limited exposure — if you ultimately decide to use real money, starting small limits the financial impact of mistakes.
Feature Priorities
Not every feature deserves equal attention. Security and risk management should typically receive more attention than flashy dashboards or marketing claims. Beginners should roughly prioritize in this order: security, risk controls, transparency, ease of use, testing capability, execution reliability, AI and social features.
Expert Strategy: Evaluating Strategies More Precisely
Consider signal quality and execution quality separately. A strong trading signal doesn't guarantee a good trade. A strategy may correctly identify market direction but lose performance due to poor timing, high spreads, excessive slippage, or oversized positions.
Don't judge a strategy based on a single short period. Evaluate performance separately across bull markets, bear markets, sideways markets, high-volatility periods, and low-volatility periods. A robust strategy should be evaluated across different environments, provided sufficient historical data exists.
Running multiple strategies doesn't automatically produce diversification. If five strategies respond to the same market signal, they may all lose at the same time. When building a multi-bot portfolio, checking correlations between strategies and correlations between underlying assets is especially important.
Automated systems shouldn't be completely ignored after activation. Set regular review intervals: review monthly performance, check drawdowns, compare actual results to expectations, audit execution costs, and check strategy correlations. Automation should reduce repetitive work, not eliminate oversight.
Measuring Bot Performance Correctly
Performance analysis should use multiple measurement dimensions: absolute returns show profit or loss over a specific period; maximum drawdown shows the largest decline from a previous peak; volatility measures the magnitude of return fluctuations; win rate shows the percentage of profitable trades.
Win rate alone can be misleading, because a strategy can have many small wins and a few large losses. Profit factor compares total winning trades to total losing trades. Risk-adjusted return metrics like the Sharpe ratio and Sortino ratio provide additional context by accounting for volatility or downside risk.
Market Conditions Determine Everything
A strategy designed for one environment may struggle in another. Trend-following bots may perform well during strong directional moves but repeatedly lose in sideways markets. Mean-reversion strategies may behave differently. AI systems must be evaluated based on the environment they're expected to operate in.
Frequently Asked Questions
What are the most important features of an AI trading bot for beginners? Risk management, ease of use, transparency, backtesting, security, reliable execution, and understandable performance reporting. Beginners should prioritize systems that make risk visible and provide clear controls.
What are the boundaries of AI trading bots? AI can process large datasets and identify statistical patterns, but it cannot eliminate uncertainty. Models can fail because market conditions change, historical relationships disappear, data is incomplete, or execution deviates from expectations.
How much money should beginners use? There's no universal amount that suits everyone. Decide after considering your financial situation, emergency savings, risk tolerance, and potential losses. Starting small reduces the consequences of early mistakes.
What's the biggest mistake? Treating automation as a substitute for understanding risk. Bots can automate execution, but users are still responsible for choosing strategies, controlling exposure, reviewing performance, and understanding potential losses.
One-line Summary
Before trying an AI trading platform, beginners should prioritize risk controls, backtesting methods, transparency, and security over returns.
Paragraph Summary
This article provides a systematic evaluation framework for beginners on AI trading platforms. The core point: automation improves execution discipline but doesn't guarantee profits. Starting with backtesting methodology, it highlights common traps like overfitting and ignoring trading costs, and introduces more reliable validation methods such as out-of-sample testing and walk-forward analysis. On transparency, it points out that raw returns mislead — they should be judged alongside risk-adjusted metrics like maximum drawdown, Sharpe ratio, and Sortino ratio. The article also explores the real capability boundaries of AI market analysis, slippage and API security risks in automated execution, and the fact that copy trading doesn't transfer professional skills. Finally, it presents six common beginner mistakes, a step-by-step evaluation framework, and multiple dimensions for measuring bot performance, emphasizing that security, risk controls, and transparency should take priority over AI features themselves.
Related articles

JobRunner MCP Server: AI Agents Can Now Fix Failed Java Jobs
JobRunner launches an open-source MCP server enabling AI agents to view cluster status, diagnose failures, and recover Java jobs—incident response from any cloud coding environment or existing agent.

MLAI Digital Launches 9 Security Agents: MCP Server Safeguards the Full Lifecycle of Agentic AI
MLAI Digital launches Security MCP Server with nine built-in specialized security agents covering vulnerability discovery, attack simulation, prompt injection detection, API and infrastructure assessment, and accelerated remediation—embedding security validation across the full Agentic AI lifecycle from development to production.

Running Isaac Lab on H100 GPUs: Exploring Better Approaches
Exploring optimization methods for running Isaac Lab on NVIDIA H100 GPUs, including MIG configuration, mixed precision, TensorRT acceleration, and community experience to improve robotics simulation and reinforcement learning efficiency.