astock-peg: An Open-Source Tool for Finding Undervalued A-Share Stocks Using the PEG Ratio

Introducing astock-peg, a tool that uses the PEG ratio to overcome PE's static valuation limitations.
The article highlights the inherent flaw of the PE ratio in ignoring corporate growth potential, and introduces the PEG ratio (PE ÷ earnings growth rate) popularized by Peter Lynch to transform valuation from a static snapshot into a dynamic assessment. It then presents astock-peg, an A-share PEG analysis tool developed with Claude Code, featuring four core modules: watchlist quote queries, AI-driven deep PEG analysis with PDF report generation, and industry PE horizontal comparison — helping investors scientifically evaluate stock valuations.
Why PE Isn't Enough: The Value of the PEG Ratio
In A-share investing, PE (Price-to-Earnings ratio) is the valuation metric most investors are familiar with. Systematized by Benjamin Graham in the 1930s, PE is a cornerstone of value investing — calculated by dividing stock price by earnings per share (EPS), it reflects the price multiple investors are willing to pay for each unit of earnings. However, PE has an inherent flaw: it's a static snapshot that completely ignores a company's future growth potential. This is particularly pronounced in the A-share market — leading companies in high-growth sectors like technology and consumer goods often maintain PE ratios of 30-50x or even higher for extended periods. If investors mechanically avoid stocks with "PE > 30x as overvalued," they'll miss the core upside phases of many quality names.
Looking at PE alone often traps people in the dilemma of "seeing expensive stocks and not daring to buy" — a seemingly expensive high-PE stock might actually be reasonably or even cheaply valued if its earnings growth rate is fast enough. This is precisely why the PEG ratio exists.
Today we're introducing astock-peg, an A-share PEG analysis tool developed with Claude Code that integrates PEG calculation, industry comparison, and AI-driven deep analysis into a single package, helping investors evaluate stock valuations more scientifically.
Risk Disclaimer: This tool is intended solely for data analysis and programming learning purposes. It does not constitute any investment advice.
What Is the PEG Ratio? A Smarter Valuation Method Than PE
The PEG (Price/Earnings to Growth) ratio was systematically explained and popularized by legendary fund manager Peter Lynch in his 1989 book One Up on Wall Street. During his tenure managing the Magellan Fund, Lynch achieved an annualized return of 29.2%, and he used PEG as one of his core tools for screening "ten-baggers." Lynch's key insight was that a company's fair PE should equal its long-term earnings growth rate — meaning PEG = 1 represents fair value. This concept was later further developed by Jim Slater in The Zulu Principle, where Slater used PEG < 0.75 as a strong buy signal and achieved notable results in the UK stock market.
The PEG formula is remarkably simple:
PEG = PE (Price-to-Earnings Ratio) ÷ Earnings Growth Rate (%)
Behind this simple division lies profound investment logic. PE tells you "at the current profit level, how many years would it take to earn back the market cap," while PEG goes further to answer "how quickly can profit growth digest this valuation." The essence of PEG is introducing the time dimension into valuation, transforming the static question of "is it expensive now?" into the dynamic question of "how fast can growth absorb the valuation?"
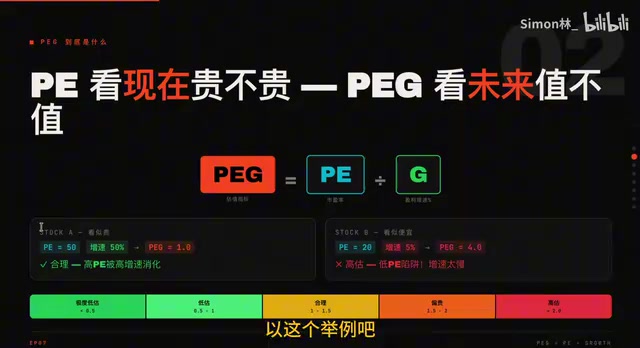
Two examples to intuitively demonstrate PEG's power:
| Metric | Stock A | Stock B |
|---|---|---|
| PE | 50x | 20x |
| Earnings Growth | 50% | 5% |
| PEG | 1 | 4 |
Stock A has a PE of 50x, which looks "expensive." But with an equally high earnings growth rate of 50%, its PEG equals 1 — the high valuation will be quickly digested by rapid growth, representing fair pricing.
Stock B has a PE of only 20x, which appears "cheap" on the surface. But with an earnings growth rate of just 5%, its PEG is a high 4 — this 20x PE will persist for a long time and is difficult to digest through earnings growth.
This is PEG's core insight: Don't look at PE's absolute value in isolation — combine it with earnings growth to judge whether the valuation is reasonable. Generally speaking, PEG = 1 is considered fair value, PEG < 1 may indicate undervaluation, and PEG > 2 warrants caution about overvaluation risk.
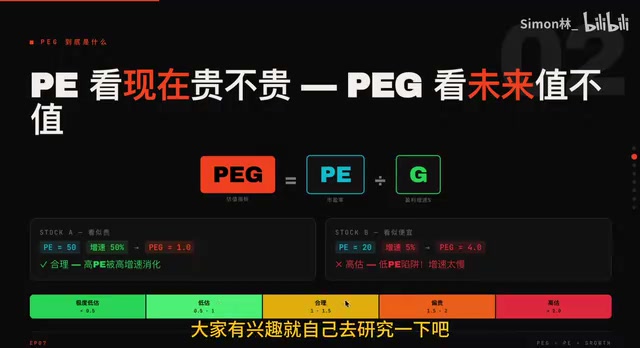
Of course, PEG's true power lies in horizontal comparison — ranking the PEG values of different stocks within the same industry side by side to discover truly undervalued opportunities.
Four Core Functional Modules of astock-peg
astock-peg is built around PEG analysis with four functional modules covering the complete workflow from data acquisition to deep analysis.
Watchlist Quote Query: Login-Free Quick Access to Valuation Data
The most basic yet most practical feature. After entering a stock code, the tool calls the Tencent Finance API to pull real-time market data, including core valuation metrics like PE and PB.

The biggest advantage of this module is that it requires no login — just open and use. For users who need to quickly check the valuation status of multiple watchlist stocks, this is an extremely convenient entry point.
AI-Driven PEG Deep Analysis: Automatically Generated Research Reports
This is the most technically sophisticated part of the entire tool. Claude Code is Anthropic's AI programming tool for developers, capable of understanding complex codebase structures, executing multi-step programming tasks, and directly manipulating files and running code in terminal environments. Unlike traditional code completion tools, Claude Code has end-to-end task execution capabilities, generating complete runnable projects directly from requirement descriptions.
After submitting a stock code, the Python script automatically collects seven categories of key data — covering financial metrics, growth trends, industry positioning, and multiple other dimensions — then hands it over to AI for comprehensive analysis, ultimately generating a deep-dive report exported as a PDF. In the field of financial data analysis, the core value of AI-assisted analysis lies in "structured processing of unstructured information" — unifying heterogeneous data such as financial statement numbers, industry news, and management commentary into a single analytical framework, simulating the multi-dimensional cross-validation process of professional research analysts. This "data pipeline + LLM reasoning" architecture is becoming the new paradigm for the convergence of quantitative research and fundamental analysis, and astock-peg is a concrete implementation of this trend at the personal investment tool level.
The AI performs cross-validation and comprehensive judgment based on multi-dimensional data, producing reports that are far more valuable as references than a single PEG number. This "data collection + AI analysis" model essentially automates the analytical framework of professional research analysts.
Industry PE Horizontal Comparison: Finding Valuation Gaps Within the Same Sector
PEG's value lies in horizontal comparison, and this module is built exactly for that purpose.
A-share industry classification primarily uses three systems: the CSRC industry classification (28 categories), the SW (Shenwan) industry classification (three-level system covering 104 tertiary industries), and the CITIC industry classification. Among these, the SW classification has become the mainstream standard for industry comparative analysis due to its granularity and widespread use in institutional research. The effectiveness of horizontal PEG comparison is built on the premise of "same-industry comparability" — companies in the same sector face similar macro environments, competitive landscapes, and business models, so their valuation differences are more likely to reflect genuine pricing deviations rather than differences in industry attributes.
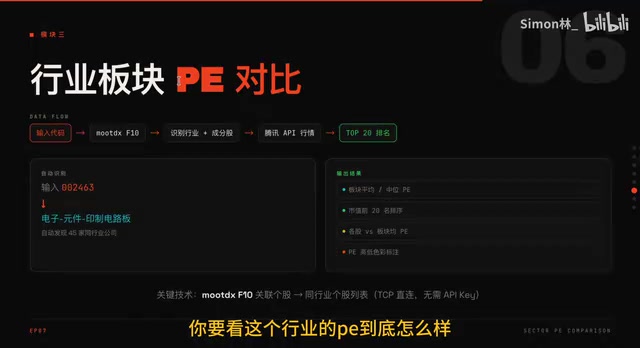
Enter a stock code, and the tool automatically identifies its industry, pulls the constituent stock list for that industry, then displays the top 20 stocks ranked by PE. Through this approach, you can intuitively see:
- What range the overall valuation level of this industry falls in
- Where the stock you're focused on ranks within the industry
- Which same-industry stocks may have valuation discrepancies
Here's an important insight: Good industries are always "expensive." If you only look at PE, you might never dare to buy sector leaders in quality tracks. But once you factor in growth rates and calculate PEG, you'll find that many "expensive" stocks are actually reasonably valued.
Related articles
 Product Reviews
The Programmer's Desk Setup Guide: Building a Workspace That Feels Like Home
Discover how programmers build productive, comfortable workspaces. From multi-monitor setups to ergonomic design, explore the desk philosophy that drives focus and flow.
 Product Reviews
Qoder vs Cursor Real-World Comparison: Which $20/Month AI IDE Is Better?
Hands-on comparison of Qoder vs Cursor AI IDEs: Agent autonomy, human interaction count, and architecture decisions. Qoder needed only 2 interactions vs Cursor's 8.
 Product Reviews
Cursor Cloud Agent Demo: Eliminating Bottlenecks Across the Entire Software Development Lifecycle
Deep analysis of Cursor's Cloud Agent demo showing how cloud VMs, automated test artifacts, and a full-chain control plane systematically eliminate human bottlenecks across the software development lifecycle.