Behind Gemini 4 Argon's Half-Price Deal: Token Consumption and Pricing Traps in Practice

Gemini 4 Argon is half price for a limited time, but uses 50% more tokens and will surpass Opus after the price hike.
Based on Google's official pricing and four tests using the same API and high effort settings, this article breaks down Gemini 4 Argon's true cost. Argon is currently priced at $2/$10 per million tokens, doubling to $4/$20 on December 1 to match Opus 5.5; output pricing includes thinking tokens and there is no free tier. Google's benchmarks show Argon leading 14 of 19, but trailing on Frontier SWE and Terminal Bench, where long coding agent tasks remain Opus's strength. In tests, all three models performed comparably on small tasks, but Argon consumed about 15,700 tokens per build, ~50% more than Opus; current build cost is 16 cents vs Opus's 21 cents, but will rise to ~32 cents after the hike. In a 71-file agent review, all 20 of Argon's findings were true and it caught real bugs at 62 cents vs Opus's $5.38, though large-codebase long sessions were not covered.
Google's Gemini 4 Argon has entered the market with a "half-price" offer, but what the price sheet doesn't say is this: its token consumption is 50% higher than competitors. Based on four hands-on tests and Google's official pricing, this article breaks down Argon's true cost and what the landscape looks like after the price doubles on December 1.
The Pricing Truth: Half Price Is Just a Limited-Time Trial
Google's pricing page shows Argon's API price at $2 per million input tokens and $10 per million output tokens, with the discount running through November 30. Starting December 1, it doubles to $4/$20—exactly the price of Opus 5.5. In addition, the output price includes thinking tokens: every time the model "thinks," it's billed as output, and Argon has no free tier. That means the limited-time half-price window has less than a month left.
"Thinking tokens" are the tokens consumed by reasoning models (such as OpenAI's o series, DeepSeekAd-R1, and Gemini's thinking mode) during internal reasoning before producing an answer. Unlike the output of ordinary models, this content is typically not shown directly to users but is still billed as output tokens. Google's pricing page explicitly states that Argon's output price includes thinking tokens, meaning the more the model "thinks," the higher the bill—even if the final answer is short. This is also why comparing models by unit price can be misleading: a model with a low unit price but verbose reasoning may end up costing more per task than a competitor with a higher unit price.
Benchmarks: What Google's Own Data Says
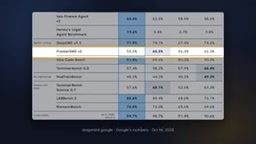
Google's comparison table lists 19 benchmarks, with Argon leading in 14 against Opus 5.5. But the four where it trails are worth noting: Frontier SWE 55 vs 62.3, Terminal Bench 57.4 vs 66.4, plus two other agent and terminal benchmarks. By the vendor's own numbers, long-running coding agent tasks remain Opus's strong suit.
Frontier SWE and Terminal Bench are representative benchmarks for measuring a model's "agent capabilities." Frontier SWE typically refers to automatically locating and fixing issues in real code repositories (similar to an enhanced SWE-bench), testing multi-turn tool calls, cross-file understanding, and long-term planning; Terminal Bench requires the model to complete multi-step operations in a terminal environment, such as configuring environments, debugging commands, and handling file systems. What both have in common is long task chains, many states, and sensitivity to error accumulation—precisely the scenarios where the article notes Opus still holds the advantage. Single-file Q&A or short script generation rarely exposes such weaknesses, so the gap in benchmark scores may be smoothed over in small-scale tests.
Four Hands-On Tests: Same API, Same Settings, High Effort
The testers compared Argon, Opus 5.5, and GPT-6 Astra using the same API and settings (high effort):
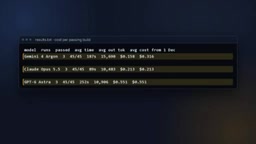
Test 1: Build a single-page cost calculator, with 15 hidden tests. All three models passed all 15 on every run. But the underlying differences were clear: Argon produced about 15,700 output tokens per build, Opus about 10,500, and Astra about 10,900. Argon consumed roughly 50% more tokens to achieve the same passing result.
Test 2: 12 questions about a 1,061-line pipeline file, 3 of which asked about features that don't exist. All three models scored a perfect 12/12 with no fabricated features.
Test 3: List 15 facts about the file, with 90 claims spot-checked: Argon had 28 true and 2 partially true, on par with Opus; Astra was 30/30 correct.
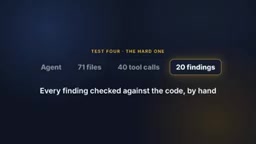
Test 4: An agent spanning 71 files with up to 40 tool calls, reporting 20 findings. Argon made 43 tool calls, and all 20 findings were true—the first being a hidden backspace bug in a script written that very day, which was silently breaking a check. Astra also scored 20/20 and found the same bug. Opus also found real bugs (including subtitle timing errors), but had 3 incorrect reports (involving files hidden by the test environment).
"High effort" refers to the adjustable reasoning budget tier of reasoning models. Most vendors offer low/medium/high tiers; the higher the tier, the more thinking tokens the model is allowed to consume before giving an answer, usually yielding higher accuracy but also higher latency and cost. The testers uniformly used high effort to compare under equal "effort levels" and avoid token consumption and quality deviations caused by different tiers. This also explains why Argon's single build output reached about 15,700 tokens: under high effort, a large number of tokens are spent on internal reasoning rather than the final code itself.
True Cost: Per Task, Not Per Token
Adding it all up: in Test 1, Argon averaged 16 cents per build, Opus 21 cents, and Astra 55 cents—Argon is currently the cheapest.
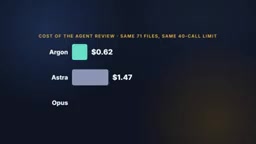
But after the price doubles on December 1, the same 15/15 build costs about 32 cents, surpassing Opus. In the agent review task, Argon cost 62 cents, Astra $1.47, and Opus $5.38. On the review task, though, Argon's token advantage is offset by its unit price.
Divergence from Harsh Reviews: Scenario Size Is Key
A high-profile review argued that Argon "fabricates most of its claims" in long agent sessions on large codebases. This hands-on test did not reproduce that problem in smaller scenarios (single file, minute-level, at most 71 files): Argon made no false claims and even found real bugs. But it must be acknowledged: Google's own table also shows Opus leading on long-running agent tasks, and this test did not cover that scenario. The root of the divergence may lie in task scale and session duration.
Action Items
The limited-time half-price offer has less than a month left. It's recommended that you run one of your real tasks with Argon this month, focus on token consumption rather than the unit price sheet, and make your decision before December 1. If you run hundreds of tasks a month, differences in token consumption will matter more than differences in unit price.
Background
When understanding cost comparisons, it's important to distinguish "unit price" from "per-task cost." Unit price is the price per million tokens; per-task cost = input tokens × input unit price + output tokens (including thinking tokens) × output unit price. Argon's current unit price is about half of Opus's, but it produces about 50% more output tokens; multiplied together, the per-task cost is still slightly lower. Once the unit price doubles, the token disadvantage directly amplifies into a cost overtake. For teams making high-frequency API calls, token efficiency (how many tokens the same task consumes) often determines the monthly bill more than the price list—especially in agent scenarios, where tool-call round trips further amplify token usage.
Related articles

Workbuddy for Absolute Beginners: How a Desktop AI Agent Fits Into Real Workflows
A beginner's guide to the Workbuddy desktop AI agent: installation, claiming credits, file management, and building automated workflows—compared with CodeX for fit and cost, helping professionals shift from AI question-askers to AI managers.

OpenAI's New Agent Stack: Computer Use, Decisions API, and Ultra-Fast Workflows
OpenAI Dev Day unveiled a new agent stack: Computer Use outperforms humans, Decisions API delivers ultra-low-latency classification via Luna, Agents API opens the same Computer Use capabilities, and GPT-6.1 Sol costs only one-seventh of Astra. Core updates, benchmark data, and developer insights.

Liang Wenfeng Open-Sources DeepInfo Inference Framework, Takes On U.S. Ban
DeepSeek open-sources its DeepInfo inference framework after its models, featuring GPU/CPU cross-pipelining, small-model prediction with large-model verification, and full Huawei Ascend and NVIDIA chip support—facing the U.S. federal ban head-on. This article analyzes its significance for AI deployment and open-source strategy.