Bias in Speech Recognition: Full-Pipeline Detection and Mitigation from Data to Deployment
Research reveals speaker verification bias runs through the entire ML pipeline, proposing inclusive evaluation guidelines and auditing tools.
A FAccT study systematically dissects bias in speaker verification. Using the VoxCeleb challenge with two ResNet models and gender/nationality subgroups, it identifies seven types of bias. Key findings: severe nationality skew with US/UK speakers leading by orders of magnitude; larger gender gaps in lightweight on-device models than large cloud models; and false negative rates surging from 2%-3% to 15% on realistic hard test sets. The study proposes five inclusive dataset design guidelines and advances the Fair EVA public auditing project.
Why Bias in Voice Biometrics Matters
When you say "my voice is my password" to your phone, this voiceprint verification system may already be quietly failing for certain groups. A study published at the ACM Conference on Fairness, Accountability, and Transparency (FAccT) systematically reveals that bias in speaker verification is not incidental but a structural problem running through the entire machine learning development pipeline.
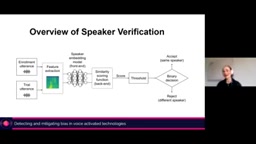
The researchers define voice activation technology as two core components: keyword spotting (wake word detection) and speaker verification as a security mechanism. The latter is essentially voice biometrics—comparing the deep embedding similarity between an enrollment utterance and a trial utterance, then making an accept/reject decision via a threshold. This pipeline is widely deployed in smartphones, financial identity verification, pension proof-of-life checks, and even national security scenarios, where failure costs far exceed those of ordinary consumer applications.
The End-to-End Speaker Verification Pipeline and Evaluation Logic
Understanding bias requires understanding the pipeline. Raw audio first undergoes feature extraction, and a deep neural network generates speaker embeddings. The embeddings of enrollment and trial utterances are compared via a similarity scoring function, and the output score is compared against a threshold to form a binary decision.
Evaluation uses the Detection Error Tradeoff (DET) curve, a transformed form of the ROC curve, with the false negative rate (same speaker rejected) on the vertical axis and the false positive rate (different speaker accepted) on the horizontal axis. The study targets the VoxCeleb Speaker Recognition Challenge, employing two 34-layer ResNet black-box models—a lightweight one suitable for on-device deployment and a larger one suitable for the cloud—and constructs speaker subgroups by gender and nationality. Bias is measured as the ratio of subgroup cost to overall cost: a ratio greater than 1 indicates the subgroup performs better than overall, while less than 1 indicates worse.
Speaker embedding is the core intermediate representation of a speaker verification system. A deep neural network maps variable-length speech into a fixed-dimensional vector (commonly 256 or 512 dimensions), designed to encode the speaker's acoustic characteristics (such as timbre, pitch, and formant distribution) while minimizing the influence of content, channel, and noise. In an ideal embedding space, vectors from the same speaker are close to each other, while those from different speakers are far apart. Since the embedding is the sole basis for subsequent similarity scoring and threshold decisions, its quality directly determines the system's fairness across subgroups—if speech samples from certain groups are scarce in the training data, the embeddings the model learns may fail to adequately represent those speakers' characteristics, causing their embeddings to be confused with others.
The Detection Error Tradeoff (DET) curve is a standard tool for biometric evaluation, sharing origins with the ROC curve but using log-log coordinates, plotting the false negative rate (FNIR) against the false positive rate (FPIR) so that differences in low-error regions are easier to observe. Each point on the DET curve corresponds to an error rate combination at a specific threshold, and the closer the curve is to the lower-left corner, the better the performance. Researchers often report the equal error rate (EER) or the false negative rate at a specified false positive rate as a single metric. In fairness analysis, plotting DET curves separately by subgroup and comparing their relative positions can intuitively reveal performance gaps across gender and nationality groups, whereas aggregate curves may mask these differences.
Seven Faces of Bias Across the Machine Learning Lifecycle
Drawing on a harm framework spanning three stages—data generation, model construction, and implementation/deployment—the researchers identify seven types of bias one by one in the VoxCeleb challenge. Below are the most representative ones.
Historical Bias: Deviations Inherited from Face Recognition
VoxCeleb 1's data comes from an automated processing pipeline for the VGG Face dataset, with candidate speakers drawn from the Freebase knowledge graph and the most-searched names on IMDb. This alone introduces geographic, nationality, and language skew. More critically, the pipeline uses a HOG-based face detector to track faces, SyncNet to identify active speakers, and finally a VGG Face CNN to verify identity—and extensive research has confirmed bias in face recognition, which propagates directly into the speaker verification dataset: speakers who cannot be correctly recognized by the face model are simply never included in the speech dataset.
VGG Face is a face recognition dataset and model series released by the Visual Geometry Group at the University of Oxford, whose CNN architecture rose to prominence in the 2014 ImageNet challenge. The VGG Face dataset scraped approximately 2.6 million face images from the internet, covering thousands of public figures. However, numerous subsequent fairness studies have shown that such web-scraped face datasets exhibit significant demographic bias: white, male, and young individuals are overrepresented, and error rates for intersectional subgroups such as dark-skinned women can be several times higher. SyncNet, meanwhile, is an audio-visual synchronization detection model based on a two-stream convolutional network, used to determine whether facial movement and speech in a video are synchronized, thereby locating active speakers. When these tools are reused to build speech datasets, their inherent biases—who can be detected, who is judged to be the speaker—propagate along the pipeline, so that the speaker composition of the speech dataset carries a structural skew from the face recognition domain from the very start.
Representation Bias: Few Speakers Outside the US and UK
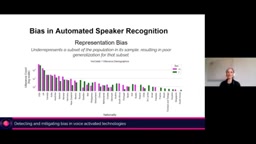
The distribution of utterance samples in the dataset is extremely imbalanced. In the nationality × gender utterance count distribution shown by the researchers, the number of speakers from the US and UK leads by orders of magnitude, with Canada, India, Australia, and Ireland still represented, while almost all nationalities after New Zealand have very few utterances. This means evaluation quality for these groups is inherently poor, and the skew in the benchmark steers the entire downstream research toward well-represented groups.
Measurement Bias: The Labeling Challenge of Nationality and Gender
The labels in speaker verification (same speaker/different speaker) are themselves determinate, but the choice of metadata labels creates another kind of bias. Nationality labels were automatically retrieved by Wikipedia based on the speaker's citizenship, with the authors intending them as a proxy for accent—yet it is common knowledge that a single country contains multiple accents and languages, and nationality cannot substitute for accent. Gender labels, meanwhile, offer only binary categories, missing non-binary groups and ignoring the enormous range of vocal pitch within the same gender.
Aggregation Bias: Subgroup Differences Masked by Average Metrics
After cross-disaggregating gender and nationality, the DET curves clearly show significant performance differences among male and female speakers of different nationalities. Reporting only aggregate performance substantially harms the interests of the many subgroup speakers in the evaluation dataset.
Learning Bias: Smaller Models May Mean Larger Bias
A comparison of the two models reveals a concerning trend: the purple curve of the lightweight model is generally higher than the green curve of the large model, which is expected; but the distance between the male and female speaker curves is noticeably larger for the small model than for the large model. In other words, bias may be amplified in the migration to small on-device models.
Evaluation Bias: Change the Test Set, and the Error Rate Triples
VoxCeleb 1 provides three test sets: VoxCeleb 1-Test contains only 40 speakers whose surnames start with E, and the sample is too small, causing severe jaggedness in the curve; VoxCeleb 1-E uses full random pairing; VoxCeleb 1-H is the "hard" test set, including only pairs of the same nationality and same gender where that combination has at least five speakers. The researchers point out that at a 1% false positive rate, the false negative rate for 1-E is about 2% to 3%, but on the more realistic 1-H it surges to 15%—equivalent to being rejected once in every two attempts.
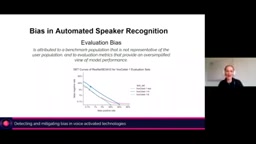
False Positive Rate (FPR) and False Negative Rate (FNR) carry asymmetric cost implications in the context of biometric security. A false positive means the system incorrectly accepts a different speaker (an impostor), directly threatening security; a false negative means the system incorrectly rejects a legitimate user, harming usability. Many benchmarks choose to compare FNR at a fixed low FPR (e.g., 1%), because security applications typically require extremely low impostor acceptance rates. However, this operating point is highly sensitive to data distribution: when the test set contains more "hard" pairs (same nationality and gender), the FNR at the same threshold rises sharply. This explains why an FNR of about 2%-3% on VoxCeleb 1-E surges to 15% on 1-H—the hard test set is closer to real-world situations where impostors and legitimate users share demographic characteristics, thereby exposing the systematic optimistic bias of aggregate benchmarks.
Deployment Bias: Mismatch Between Threshold Selection and Error Costs
Deployment bias arises when the application scenario does not match the conceptual assumptions at development time. If the threshold is chosen based on the aggregate population, performance degrades significantly when deployed to a specific group. A deeper problem lies in the cost tradeoff between false positives and false negatives: voice biometrics was not originally designed for consumer personal devices, and the cost of false negatives was not fully considered; but when it is used for bank access or pension proof-of-life verification, the trouble caused by the system failing to recognize you far exceeds previous understanding.
The Remedy: Design Guidelines for Building Inclusive Evaluation Datasets
Addressing evaluation bias, the researchers propose an utterance-pair grading system and a dataset construction algorithm. Same-speaker pairs are graded by difficulty: same recording instance (trivial) and cross-recording instance (medium). Different-speaker pairs are divided into four levels: different gender and different nationality (trivial), different gender and same nationality (easy), same gender and different nationality (medium), and same gender and same nationality (hard). The researchers state bluntly that truly hard samples should include family members or office colleagues—and those who could crack your phone wallet are often your sister, mother, or daughter.
Based on this grading, the research team constructed a new dataset covering eight nationalities, with 520 different-speaker utterance pairs per speaker (1,040 pairs total). The key difference from VoxCeleb 1-H is that the number of utterance pairs is equal for each speaker and each subgroup, and trivial same-speaker pairs are completely excluded. The evaluation results are striking: at a 1% false positive rate, when same-speaker pairs contain only medium difficulty, the false negative rate rises from about 5% to 15%—performance in realistic scenarios is far worse than the benchmark suggests.
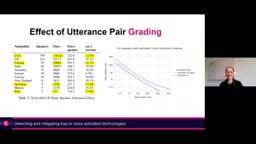
The number of utterance pairs is equally critical. The researchers generated five datasets with different random seeds and compared conditions of 50, 225, and 520 pairs per speaker: with fewer pairs, the performance curves show great dispersion, and as the number increases the curves gradually converge, significantly improving evaluation robustness. This yields five design guidelines: equal numbers of same/different-speaker pairs per speaker; at least 500 different-speaker pairs per speaker; balanced pair counts across speakers and subgroups with a uniform difficulty distribution; difficulty grading that reflects real usage scenarios; and generating multiple random pair sets and evaluating each separately to ensure performance is not an artifact of a single random generation.
Fair EVA: From Academic Research to Public Auditing
The researchers are advancing a project outside academia called Fair EVA, which has received funding from the Mozilla Technology Fund, aiming to build auditing tools and a knowledge base for evaluating bias in voice biometrics. Five parallel directions include: a Python library for bias testing (a more complete version expected to be released soon), speaker verification fairness evaluation guidelines based on the above work, technical audits of commercial voice biometric products (taking an external perspective, since collaboration with companies is often difficult), interactive multimedia resources explaining voice biometrics to the public, and a resource database for other researchers.
The significance of this work lies in transforming "bias" from an abstract concept into a measurable, auditable, and designable engineering problem. When voice becomes an identity credential, the inclusiveness of evaluation datasets is no longer academic nitpicking but a prerequisite for system reliability.
One-line Summary
Research reveals that speaker verification bias runs through the entire machine learning pipeline, and proposes inclusive evaluation guidelines and auditing tools.
Paragraph Summary
A study published at the FAccT conference systematically analyzes bias in speaker verification within voice biometrics. Targeting the VoxCeleb challenge with two ResNet black-box models, the study constructs subgroups by gender and nationality and identifies seven types of bias: historical, representation, measurement, aggregation, learning, evaluation, and deployment. Key findings include: the dataset's nationality distribution is severely skewed, with US and UK speakers leading by orders of magnitude; the gender performance gap is larger for the lightweight on-device model than for the large cloud model; and on the more realistic hard test set, the false negative rate at a 1% false positive rate surges from about 2%-3% to 15%. The study proposes five design guidelines for inclusive evaluation datasets, requiring at least 500 different-speaker pairs per speaker, a uniform difficulty distribution reflecting real scenarios, and advances the Fair EVA public auditing project to turn bias into a measurable, auditable engineering problem.
Related articles
Claude Code in Practice: Filling in Tests with Boundary Cases, Coverage, and Assertions
A practical guide to using Claude Code for unit tests: generating boundary cases with global context, locating uncovered branches to boost coverage, and writing effective assertions. Compares Cursor and Trae.
Test Report in Three Minutes? Lemon Test Report Skill Hands-On: No Fabrication, Fully Auditable
A Bilibili creator shares Lemon Test Report Skill: an AI reporting tool for testers with three modes—test summary, regression verification, and release acceptance. It flags missing data as 'to be confirmed,' catches manual data conflicts on the spot, and outputs an editable draft, a web report, and a verification data package.

Giving a Toilet an IP Address with a Raspberry Pi: An Absurd Yet Hardcore IT Experiment
An IT blogger assigned an IP address to his toilet using a Raspberry Pi and float switch, monitoring flushes via GPIO and correlating with network disconnection logs. This article breaks down the hardware wiring, pull-up resistor principles, 0.1-second polling logic, and installation process, extending to similar approaches in AI Agent security monitoring.