Browser Tools MCP: A Debugging Power Tool That Lets Cursor Read Browser Logs Directly
Browser Tools MCP pipes browser debugging info directly into your IDE via the MCP protocol for faster development.
Browser Tools MCP is an open-source project built on Anthropic's MCP protocol that syncs browser console logs, network requests, JS errors, and performance metrics in real time to IDEs like Cursor. It eliminates the pain of constantly switching between browser DevTools and your editor. Its core value lies in enabling AI coding assistants to read runtime information directly, transforming them from "guessing problems with closed books" to "fixing problems with open books," dramatically improving debugging accuracy and efficiency.
Project Overview
Every web developer knows the drill — constantly jumping between browser DevTools and your code editor. Check the console for errors, switch back to the editor to fix the code, then switch again to refresh and verify. Browser Tools MCP is an open-source project designed to solve exactly this pain point: it uses the MCP protocol to pipe browser logs, network requests, and error messages directly into IDEs like Cursor, eliminating the constant context-switching.
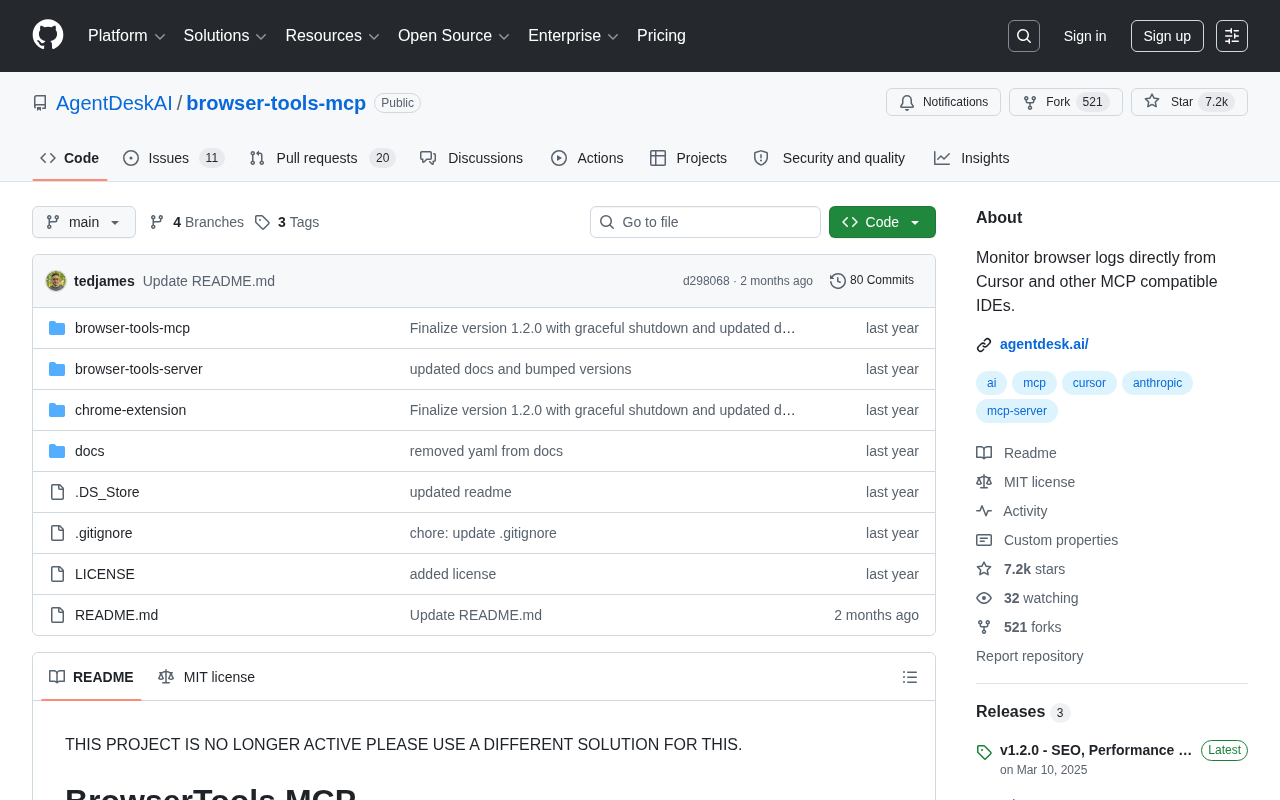
The project is developed and maintained by the AgentDeskAI team. With over 7,200 Stars and 522 Forks on GitHub, it's one of the most popular utility projects in the MCP ecosystem.
What Is the MCP Protocol?
MCP (Model Context Protocol) is an open protocol introduced by Anthropic. Its core purpose is to provide AI models with standardized access to external tools and data sources. Think of it as a "universal interface" between AI assistants and various tools — with this protocol, AI can securely read local files, query databases, and call APIs.
Before MCP, integrating external tools with AI coding assistants required writing custom integration code for each tool — much like the early days when every hardware device needed a proprietary driver. MCP's design philosophy is similar to USB: define a standard communication specification so that any tool implementing the MCP Server interface can be called by any AI application that supports the MCP Client. Anthropic's strategic intent in open-sourcing it is clear — by establishing an ecosystem standard, they expand the practical boundaries of Claude and the entire AI assistant category. The MCP ecosystem now covers tool services across multiple domains including file systems, databases, version control, and browsers, forming a rapidly growing plugin marketplace.
Browser Tools MCP is built on this protocol, bridging browser runtime information into the IDE environment.
Core Features Explained
Real-Time Browser Log Synchronization
The most fundamental capability of Browser Tools MCP is pushing all types of browser-generated information to the IDE in real time. While writing code, developers can see:
- Console output: All log levels including console.log, console.warn, console.error
- Network request details: API call URLs, request parameters, response status codes, and return data
- JavaScript runtime errors: Exception messages and complete stack traces
- Page performance metrics: Load times, resource sizes, and other key data
Under the hood, these capabilities rely on the Chrome DevTools Protocol (CDP) — a debugging interface exposed by Chrome that DevTools itself uses to communicate with the browser engine. The browser extension connects to CDP via the chrome.debugger API, allowing it to listen to request events from the Network domain, console output and exceptions from the Runtime domain, and performance metrics from the Performance domain. In traditional development workflows, developers switch between their editor and browser an average of 3-5 times per debugging session, with each switch causing attention interruption and context loss. Research shows that programmers need an average of 15-25 minutes to regain their previous level of focus after being interrupted, and frequent window switching is a textbook source of these micro-interruptions.
No more manually opening DevTools to dig through information — all the data is right where you write your code.
AI-Driven Intelligent Debugging
The real killer feature of this tool lies in its synergy with AI coding assistants. When the AI in Cursor can directly read browser logs, the debugging experience transforms fundamentally:
- With access to real error stack traces, the accuracy of AI-generated fix suggestions improves dramatically
- When network requests return 404 or 500 errors, AI can analyze the cause by cross-referencing API documentation and code logic
- When frontend rendering anomalies occur, AI can diagnose issues by simultaneously referencing the code and runtime state
To understand why this capability matters, you need to know a core limitation of large language models: their reasoning quality is highly dependent on the quality and completeness of the input context. When AI can only see source code, it's essentially performing "static analysis" — guessing potential problems based on code patterns. But many bugs only trigger under specific runtime conditions, such as an API returning an unexpected data structure, an async operation with a timing issue, or an environment variable that isn't configured correctly. This information is invisible in the source code. Injecting runtime error messages, network response data, and actual variable states into the AI's context window is like turning the AI from a "closed-book exam" to an "open-book exam" — it can reason based on facts rather than guesses, naturally resulting in much higher diagnostic accuracy.
Put simply, AI goes from "guessing problems by looking at code" to "fixing problems by looking at actual errors" — a fundamental difference.
Broad IDE Compatibility
The project is built with JavaScript and architecturally supports all MCP-compatible IDEs — Cursor is just one of them. As more editors adopt the MCP ecosystem, this tool's reach will continue to expand.
Technical Architecture Breakdown
Browser Tools MCP uses a three-layer architecture:
- Browser Layer: A browser extension captures runtime events, logs, and network activity from the page
- MCP Server Layer: A locally running middleware service that receives browser data and converts it to MCP protocol format
- IDE Client Layer: The MCP Client consumes the formatted data, displaying it in the editor or providing it to the AI model
In terms of implementation, the browser extension and MCP Server typically establish a persistent connection via WebSocket. Compared to traditional HTTP polling, WebSocket provides full-duplex communication with latency as low as milliseconds — ideal for real-time log pushing scenarios. The browser extension runs in an isolated extension process and declares required permissions like debugger and tabs through Chrome's permission model (Manifest V3), ensuring data collection only occurs within the user-authorized scope. On the MCP Server side, raw browser event data is encapsulated into standardized Tool call responses following the MCP protocol specification — the AI model in the IDE can call predefined Tools (such as getConsoleLogs, getNetworkRequests) to fetch specific types of browser data on demand, rather than passively receiving a flood of all information. This "pull on demand" design both conserves the AI's context window space and gives developers precise control over what information the AI accesses.
The benefits of this three-layer decoupling are obvious: the browser extension can be updated independently, the Server can connect to different data sources, and the Client can adapt to different IDEs — community contributors can work on each layer independently.
Typical Use Cases
- Frontend page debugging: Quickly locate rendering anomalies and JS errors without switching between browser and editor
- Full-stack integration testing: Observe frontend requests and backend API responses simultaneously in a single interface for complete visibility
- AI-assisted bug fixing: Provide AI with complete error context for more reliable code suggestions
- Team troubleshooting: A unified log collection method that makes problem reproduction and collaborative communication easier
Summary
Browser Tools MCP represents a clear trend: information silos between development tools are being torn down. The seamless flow of browser runtime data into IDEs and AI assistants delivers tangible improvements to everyday debugging efficiency.
Behind this trend is a deeper transformation across the entire development tools industry. IDEs are evolving from pure code editors into "development platforms" — integrated terminals, version control, database management, and container orchestration have long been standard features, while AI assistants and external runtime data integration are the latest extensions of this evolution. The competitive focus of products like Cursor, Windsurf, and VS Code + Copilot has shifted from "code completion accuracy" to "how rich a context can AI access." Whoever enables AI to see the most complete development picture — including code, documentation, runtime state, and deployment logs — will deliver the strongest AI-assisted experience. Tools like Browser Tools MCP are filling in critical pieces of the puzzle for this "AI-native development environment" vision.
If your daily work involves web frontend development and you're using Cursor or another MCP-compatible editor, this project is worth ten minutes of setup time — once you've experienced it, you'll most likely never want to go back to your old workflow.
Related articles
 Product Reviews
The Programmer's Desk Setup Guide: Building a Workspace That Feels Like Home
Discover how programmers build productive, comfortable workspaces. From multi-monitor setups to ergonomic design, explore the desk philosophy that drives focus and flow.
 Product Reviews
Qoder vs Cursor Real-World Comparison: Which $20/Month AI IDE Is Better?
Hands-on comparison of Qoder vs Cursor AI IDEs: Agent autonomy, human interaction count, and architecture decisions. Qoder needed only 2 interactions vs Cursor's 8.
 Product Reviews
Cursor Cloud Agent Demo: Eliminating Bottlenecks Across the Entire Software Development Lifecycle
Deep analysis of Cursor's Cloud Agent demo showing how cloud VMs, automated test artifacts, and a full-chain control plane systematically eliminate human bottlenecks across the software development lifecycle.