Chrome DevTools for Agents: Enabling AI to Autonomously Complete End-to-End Debugging

Google's DevTools for Agents lets AI autonomously debug web apps in real Chrome browsers, end to end.
Unveiled at Google I/O Connect, DevTools for Agents gives AI coding agents access to Chrome's developer tooling. By capturing console logs, network requests, and leveraging source maps, AI can reproduce bugs, trace errors to source files, and apply fixes autonomously — creating a true closed-loop debugging workflow without human step-by-step intervention.
Article
At Google I/O Connect, a new capability called DevTools for Agents drew widespread attention. It opens Chrome's developer tooling to AI coding agents, enabling AI to move beyond "blindly writing code" and instead enter a real browser environment — just like a human engineer — to observe runtime state, identify issues, and complete fixes. This marks a pivotal shift in AI programming: from "static code generation" to "closed-loop autonomous debugging."
The Evolution of AI Coding Tools: AI coding tools have gone through three distinct phases. Phase one was code completion (exemplified by GitHub Copilot), where AI acted as a "smart autocomplete" inline within editors. Phase two was conversational code generation (ChatGPT, Claude), where developers described what they needed and AI output complete code blocks. Phase three is Agentic Coding — represented by Devin, Claude Code, and Cursor Agent — where AI can execute multi-step tasks, read and write files, and run commands. DevTools for Agents marks a critical leap in this third phase: agents expand from operating on the filesystem to operating on a real browser runtime, gaining the ability to "perceive how an application actually behaves" — a closed-loop verification mechanism that was missing from all previous phases.
From Reading Files to Reading the Runtime
Traditional AI coding assistants, when fixing bugs, typically rely on developers manually pointing them to "look at a specific file" or "check a certain piece of code." The fundamental flaw in this approach is that the AI has zero awareness of the application's actual runtime state — it can't see console errors or the real responses to network requests.
"Instead of asking our agent to look at specific files, we ask it to look at the runtime."
This quote captures the core conceptual shift behind DevTools for Agents: instead of having the agent guess where code is going wrong, it directly observes the program's runtime behavior. Critically, with source maps support, DevTools for Agents can trace runtime errors back to specific source files, guiding the coding agent to pinpoint exactly where changes need to be made.
Source Maps Background: Source Maps are a technical specification that maps compiled/minified code back to the original source code. Modern frontend projects typically go through TypeScript compilation, Babel transpilation, and Webpack/Vite bundling and minification — the code running in the browser looks nothing like what the developer originally wrote. A
.mapfile records the precise location in the original source that corresponds to each line of minified code, allowing Chrome DevTools to point directly to line 42 of the developer's TypeScript file when showing an error, rather than some character position on line 1 ofbundle.min.js. DevTools for Agents leverages this mechanism so that when an AI agent sees a runtime error, it can cut through the build artifacts and locate the actual source file that needs to be changed — without hunting through minified, obfuscated output code.
This means developers don't need to know the project structure in advance or manually navigate to the failing module — the runtime information itself becomes the best "fault signpost."
A Complete End-to-End Fix Flow
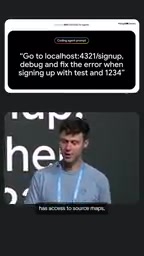
The demo presented a very concrete scenario: in a local development environment, a user visits localhost/signup and encounters an error when trying to register with the test account test and password 1234. The developer's prompt is entirely natural:
"go to localhost/signup, debug and fix the error when signing up with test and 1234."

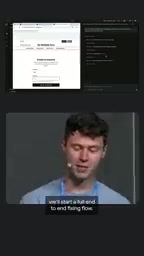
When this instruction is executed by a coding agent with DevTools for Agents enabled, a complete end-to-end fix flow kicks off. The entire process requires no step-by-step human intervention — the agent autonomously carries out a series of debugging actions that would otherwise require an engineer to perform manually.
What Steps Does the Agent Actually Take?
According to the demo, this autonomous debugging flow includes the following key steps:
- Open a real browser: The agent launches an actual Chrome instance — not a simulated environment — ensuring the observed behavior exactly matches what the user encounters.
- Actively reproduce the issue: The agent attempts to sign up using the provided test credentials, deliberately triggering the error scenario.
- Capture runtime information: During the interaction, it collects console logs and network requests — the primary first-hand clues that human developers rely on most when debugging.
- Synthesize and fix: All "clue pointers" are aggregated, source maps are used to trace back to the source code, and the code is modified to complete the fix.

Chrome DevTools Protocol (CDP) and the Automation Foundation: The underlying technology powering DevTools for Agents is the Chrome DevTools Protocol (CDP), the debugging interface Chrome exposes to external programs. CDP allows external programs to connect via WebSocket to control the browser, listen to console output, intercept network requests, execute JavaScript, and more. Automation frameworks like Playwright and Puppeteer are built on CDP or its derivative WebDriver BiDi protocol. What makes DevTools for Agents innovative is that it wraps CDP's debugging capabilities into structured tool interfaces consumable by AI agents (Tool Use/Function Calling), enabling large language models to systematically invoke debugging primitives like "get console logs," "monitor network requests," and "read DOM state" — rather than merely executing scripts.
The value of this flow is that it hands the complete mental model a human engineer uses when debugging a web application — reproduce, observe, locate, fix — over to AI for automatic execution, dramatically reducing the human effort spent on repetitive debugging work.
Why This Is an Important Evolution for AI Programming
The key weakness of most current AI coding tools is precisely the lack of interaction with real runtime environments. They excel at generating code from textual descriptions, but struggle to verify whether that code actually works in a browser. DevTools for Agents fills exactly this gap, building a genuine closed feedback loop:
Write code → Run → Observe results → Find issues → Fix → Run again
The Significance of Closed Feedback Loops for AI Reliability: The concept of a "closed feedback loop" originates from cybernetics — it refers to a system where output feeds back to influence subsequent input, forming a self-correcting cycle. In the context of AI programming, the absence of a closed loop has been the core bottleneck for reliability: large language models generate code based on pattern matching from training data and cannot perceive the actual execution results in a specific current environment. This causes AI bug fixes to frequently fall into a cycle of "guess → generate → still wrong," requiring developers to repeatedly paste error messages and manually push things forward. With runtime feedback introduced, AI agents can autonomously iterate through "fix → verify → continue debugging if failed" — closely aligned with the trial-and-error mechanism in reinforcement learning, and a canonical example of the "tool use + environment interaction" paradigm in current AI agent research.
Within this loop, the AI agent can self-verify whether a fix actually worked, rather than treating "the code looks fine" as task completion. This ability to self-correct based on real runtime feedback is a critical breakthrough for improving the reliability of AI programming.
What This Means for Frontend and Full-Stack Developers
For frontend and full-stack developers, this kind of capability could significantly change how everyday debugging works. The time-consuming, repetitive work of "reproduce the bug, comb through the console, check network requests, trace back to source code" could be handed off entirely to an AI agent. Developers simply describe the problem in natural language, and the subsequent investigation and fix are handled by the agent.
Of course, this capability is still at the demonstration stage. Its stability on complex real-world projects, its ability to handle multi-step interaction scenarios, and the controllability of fix quality all remain to be validated through broader real-world use. But the direction it points toward is clear: AI coding agents are gaining the ability to "run the program themselves."
Conclusion
Chrome DevTools for Agents showcases the next phase of AI programming — no longer a passive code generator, but an intelligent collaborator that can enter a real browser, perceive the runtime, and autonomously complete end-to-end debugging. When AI can "open a page, trigger an action, check the logs, and fix the code" just like an engineer, the boundary of human-AI collaboration is being redefined. For all developers following the evolution of AI coding tools, this kind of closed-loop feedback debugging capability is well worth tracking closely.
Key Takeaways
Related articles

What Is Vibe Coding? The AI Programming Skill Every Developer Needs
What is Vibe Coding? Learn how AI programming is reshaping dev teams, why traditional programmers face displacement, and why Cursor & Claude Code matter.
Making Rocks Think: A Philosophical Exploration of Generative AI and Information Compression
From a viral Reddit post to deep AI theory: why compression equals understanding, the Library of Babel thought experiment, semantic compression, and the Hutter Prize.
Irregular Warns: Four AI Lab Security Breaches Traced to the Same Root Cause
Irregular reveals four AI lab security breaches share a single root cause, exposing systemic risks from technology stack homogeneity across the AI industry.