Claude Code + Codex Dual-Agent Collaboration: A Full-Stack WebGIS Development Deep Dive

Build full-stack WebGIS systems using Claude Code + Codex dual-agent collaboration — no deep coding expertise required.
This article introduces a WebGIS development course for researchers built around a dual-agent paradigm: Claude Code handles engineering implementation, Codex handles code review, and the researcher defines requirements and validates results. The curriculum spans Leaflet interactive maps, MapLibre integration with NASA GIBS and EONET real satellite data, ECharts and Canvas dashboards, PostGIS spatial databases, Express backends, and full Alibaba Cloud ECS deployment — concluding with eight research-themed capstone projects that students personalize into publicly accessible deliverables.
Spatial data visualization is rapidly becoming a hard requirement for research grant applications, award submissions, and client presentations. Yet the full-stack technical barrier — interactive frontend maps, spatial databases, backend APIs, and cloud deployment — has long blocked research teams at the "last mile" of turning their work into deliverables. A course taught by instructor Deng, recommended by the Bilibili channel "AI上研修," focuses on a highly practical solution: using a dual AI Agent collaboration model combining Claude Code and Codex to enable researchers with limited programming experience to independently build complete WebGIS systems.
This article, based on the course's curriculum, outlines the technical logic of the dual-agent collaboration paradigm and the practical framework for full-stack WebGIS development.
The Dual-Agent Paradigm: Who Builds, Who Reviews
The core methodology of this course is breaking down AI-assisted development into clearly defined roles: Claude Code handles engineering implementation, Codex handles quality review, and the researcher defines requirements and accepts the final deliverable. This "implement–review–accept" three-way division essentially maps the roles of a traditional software team onto a human-AI collaboration context.
Instructor Deng uses a vivid analogy to explain what an AI Agent actually is. He defines an Agent as "Model + Harness": the large language model is the engine, while the Harness is the car body — the steering wheel, throttle, brakes, and windows — all of which combine to make the car "run in the right direction." He extends the metaphor: "The model is a wild horse that runs wild and makes mistakes. The Harness is the saddle that keeps the horse on the right path."
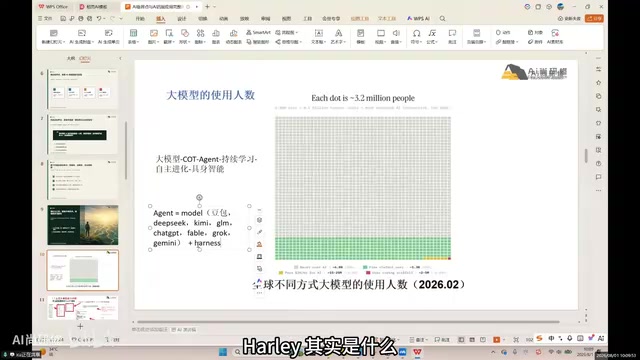
This analogy highlights a key insight about current AI coding tools: a plain LLM chat interface (such as Doubao, DeepSeekAd, Kimi, GPT, Grok, or Gemini) can only converse. To actually drive project-level development, you need a Harness with real engineering execution capability — like Claude Code or Codex. The course also covers configuring Claude Code's routing and model access via tools like SwitchHosts to build a fully operational Agent. These configuration details are precisely where many researchers hit a wall when first engaging with AI-assisted programming.
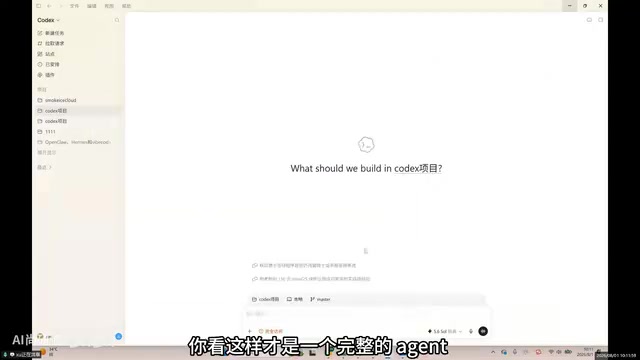
Claude Code and Codex have fundamentally different design philosophies, and understanding this distinction helps justify the dual-agent approach. Claude Code is Anthropic's command-line AI coding tool — it can directly read and write local files, execute terminal commands, and call external tools, giving it the ability to work continuously within a real project directory. Codex is OpenAI's code generation and review model (now deeply integrated into the ChatGPT and GitHub Copilot ecosystems), and excels at static analysis of existing code, identifying logic flaws and security vulnerabilities. The "one builds, one reviews" division leverages each tool's design strengths: Claude Code excels at coherent engineering execution, while Codex excels at critical code-level review. This dual-engine model partially replicates the Developer + Code Reviewer dynamic in a human development team, maintaining basic code quality control without a professional engineer in the loop.
From Leaflet to MapLibre: Bringing in Real Geographic Data
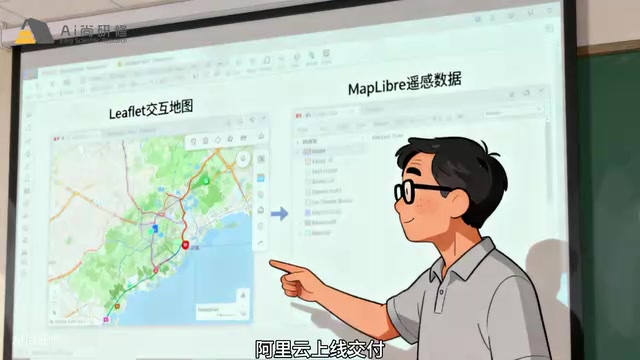
The map development section of the course progresses through two levels. Leaflet interactive maps serve as the entry point, covering OSM dark basemap loading, latitude/longitude and zoom level concepts, GeoJSON attribute-based classification and choropleth styling, proportional symbols and highlight styles, as well as layer controls, legends, popups, click queries, and bounding box selection. This level also emphasizes engineering robustness — handling popup escaping, empty data notices, and layer load failure fallbacks — resulting in a reusable thematic map template.
The advanced section shifts to MapLibre with real satellite data. This requires understanding vector tiles, raster tiles, style expressions, and layer ordering, and involves integrating NASA GIBS layers including true color, precipitation, temperature, ocean color, sea surface temperature, and sea ice, as well as real-world event data from EONET covering typhoons, fire points, floods, and icebergs. Features implemented include date switching, timeline playback, multi-day compositing, and skipping missing data frames. The leap from simulated data to real NASA-grade remote sensing data is what distinguishes scientific visualization from ordinary web projects.
NASA GIBS (Global Imagery Browse Services) and EONET (Earth Observatory Natural Event Tracker) are two key data services that NASA makes available to the public and research community. GIBS is an image tile service providing daily or multi-day composite remote sensing imagery from satellites including Terra, Aqua, and GOES. It supports standard WMTS/TMS protocols and can be loaded directly as raster tiles into map frameworks like MapLibre, covering dozens of products such as true color, chlorophyll concentration, sea surface temperature, precipitation intensity, and sea ice extent. EONET is an event-based database that publishes discrete events in GeoJSON format in near real time — typhoon track points, wildfire locations, volcanic eruptions, and flood extents — suitable for vector layer overlays. Using them together — GIBS for the background remote sensing field, EONET for event location markers — is the standard approach for research-grade thematic maps, and forms the data foundation for the timeline playback feature in the course.
Dashboard Visualization: ECharts Charts and Canvas Animations
For presentation scenarios, the course uses ECharts and Canvas to build a high-tech-style data dashboard. The overall layout includes a main map view, metric cards, trend charts, legends, and time and spatial controls. ECharts handles trend charts, regional statistics, and gauges, with interactive linkage to map state; Canvas powers particle effects, station pulses, typhoon tracks, and data flyline animations.
This section also emphasizes performance considerations in real engineering — responsive layout adaptation, low-performance mode, pausing animations when the tab is hidden, and on-demand loading. These details determine whether the dashboard runs smoothly during an actual client presentation, and are often the hidden factors that determine a project's perceived quality.
PostGIS Spatial Database and Express Backend
A real WebGIS system requires a spatial database at its core. The course uses Docker to launch PostgreSQL + PostGIS, covering foundational concepts like databases, tables, spatial fields, and SRIDs, importing GeoJSON and Shapefile data and building GiST spatial indexes, and writing spatial SQL for bounding box queries, nearest-neighbor distance, buffer zones, and intersection tests. A key skill here is translating business problems into SQL — "find points in the current view, find nearby facilities, aggregate statistics by region."
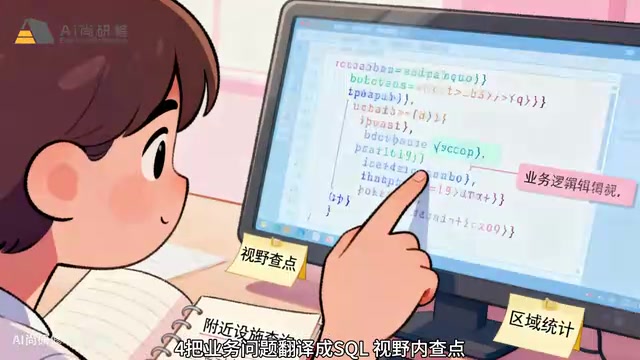
The backend uses Express to bridge frontend and backend: configuring environment variables, database connection pools, and health checks; wrapping REST APIs (bounding box queries, point selection, nearest neighbor, attribute filtering, limit constraints); and using parameterized queries to prevent SQL injection, with latitude/longitude and bounding box validation. The frontend calls these APIs to dynamically render returned GeoJSON on the map and handles loading and error states. Though foundational, this architecture comprehensively covers the security and robustness essentials of a production-grade web application.
PostGIS is a spatial extension for PostgreSQL that enables the relational database to store geometry types such as points, lines, and polygons, and provides hundreds of spatial functions including ST_Intersects, ST_DWithin, ST_Buffer, and ST_Distance, supporting efficient spatial queries via GiST (Generalized Search Tree) indexes. An SRID (Spatial Reference Identifier) is an integer code in PostGIS that identifies a coordinate system — for example, SRID 4326 corresponds to the WGS84 geographic coordinate system (standard latitude/longitude), and SRID 3857 corresponds to the Web Mercator projection (the standard coordinate system for WebGIS basemaps). Correctly specifying the SRID when importing GeoJSON or Shapefile data is a prerequisite for accurate spatial query results. Compared to traditional file-based GIS workflows, the biggest advantage of loading spatial data into a database is that spatial logic (e.g., "stations within a buffer zone") and business logic (e.g., "with observation records in the past 7 days") can be combined in a single SQL query. The backend API then returns GeoJSON directly, which the frontend can render without additional conversion, dramatically simplifying the data pipeline.
Alibaba Cloud Deployment and the Eight-Theme Capstone Project
The full-stack journey concludes with Alibaba Cloud ECS deployment: understanding the relationships between ECS, Nginx, Node services, Docker, PostGIS, domain names, and HTTPS; building and deploying the frontend as a static site; running the backend via process manager or containerized; configuring Nginx reverse proxy, CORS, security groups, and logging; handling pre-filing temporary IP access, formal domain name ICP filing, and rollback and backup strategies — ultimately producing a publicly accessible demo URL.
The course concludes with a capstone project offering multiple real-world themes for students to choose from and personalize: ocean chlorophyll (PACE OCI 8-day rolling composites), global typhoons and tropical storms (EONET real tracks with multi-storm synchronized animation), global extreme precipitation (GPM IMERG daily playback), near-surface temperature with satellite fire point overlay, sea surface temperature and ocean currents (GHRSST SST with Gulf Stream, Kuroshio, Equatorial Current, and ACC streamlines), regional flood inundation monitoring, agricultural/forest vegetation NDVI, and polar sea ice comparison. For each theme, Claude Code completes features according to a task checklist, Codex reviews and lists revisions, and students swap in their own titles, layers, study areas, and indicators to create personalized deliverables.
Is It Worth It? A Pragmatic Assessment
The course's value proposition is clear: it targets not professional frontend engineers, but researchers who have a genuine need for visualization but lack full-stack capabilities. The dual-agent collaboration model lowers the coding barrier; the eight themes cover the complete pipeline from workspace setup to cloud deployment; and integration with real data sources like NASA GIBS and EONET gives the outputs scientific credibility.
It's worth being realistic, however: AI Agent collaboration is still rapidly evolving, tool configuration (e.g., SwitchHosts, model routing) carries non-trivial complexity, and course outcomes are heavily dependent on the student's ability to define requirements and validate results — after all, the "you handle acceptance" step cannot be outsourced to AI. For researchers who want to produce WebGIS outputs quickly and are willing to learn an AI-assisted workflow, this approach offers a viable reference framework.
Related articles

Felix Rieseberg Personal Homepage
Felix Rieseberg's personal homepage sparks attention on Hacker News. This article covers the Slack engineer's technical background, the rise and fall of nativefier, and the value of a developer homepage as a tech calling card.

@ai-sdk/vue 3.0.306 Patch Release Syncs with [email protected] Update
@ai-sdk/vue 3.0.306 released, synced with [email protected]. A routine patch release for the Vercel AI SDK ecosystem with no public API changes; the Vue adapter layer stays version-aligned with the core package.

Gemini 4 Argon API Launches: The Era of Million-Token Output Begins
Google launches Gemini 4 Argon with sparse MoE architecture, up to 1M output tokens, and a 68.90% Vals Index score, available across API, AI Studio, and the Gemini app.