Dashi Metrics: A Real-Time Visualization Tool That Maps Revenue Data onto a 3D Globe

Dashi Metrics visualizes real-time revenue and visitor data on an interactive 3D globe for global SaaS teams.
Dashi Metrics is a real-time visualization tool that maps revenue and visitor data onto an interactive 3D globe, targeting SaaS teams and indie founders with global audiences. Launched on Product Hunt to immediate traction (#4 daily), it transforms static dashboards into explorable geographic experiences. While compelling for presentations and high-level overviews, its long-term value depends on data integration depth and whether it can evolve beyond novelty into a daily operational tool.
When Data Dashboards Meet the 3D Globe
Traditional business dashboards are typically composed of dense line charts, bar graphs, and numerical tables—packed with information, yet lacking intuitive spatial awareness and immediacy. Mainstream BI tools like Tableau, Looker, and Metabase do support map layers, but usually present them as 2D choropleths (graduated statistical maps) or scatter plots. While this approach is effective enough for displaying single-dimension geographic distributions, it struggles to convey the "dynamic pulse" of data—the real-time rhythm of transactions and the flow state of global business. Moreover, the mapping features in traditional tools are often buried deep within report configurations, requiring a certain level of data analysis skills to use effectively, creating a learning curve for non-technical founders.
Dashi Metrics, which recently launched on Product Hunt, aims to break through this monotony by mapping enterprise revenue and visitor data in real-time onto an interactive 3D globe, making global business flows immediately visible.
The product quickly gained traction after launch, earning 121 upvotes and 9 comments, climbing to #4 on the daily leaderboard, with categories spanning Analytics, SaaS, and Data Visualization.
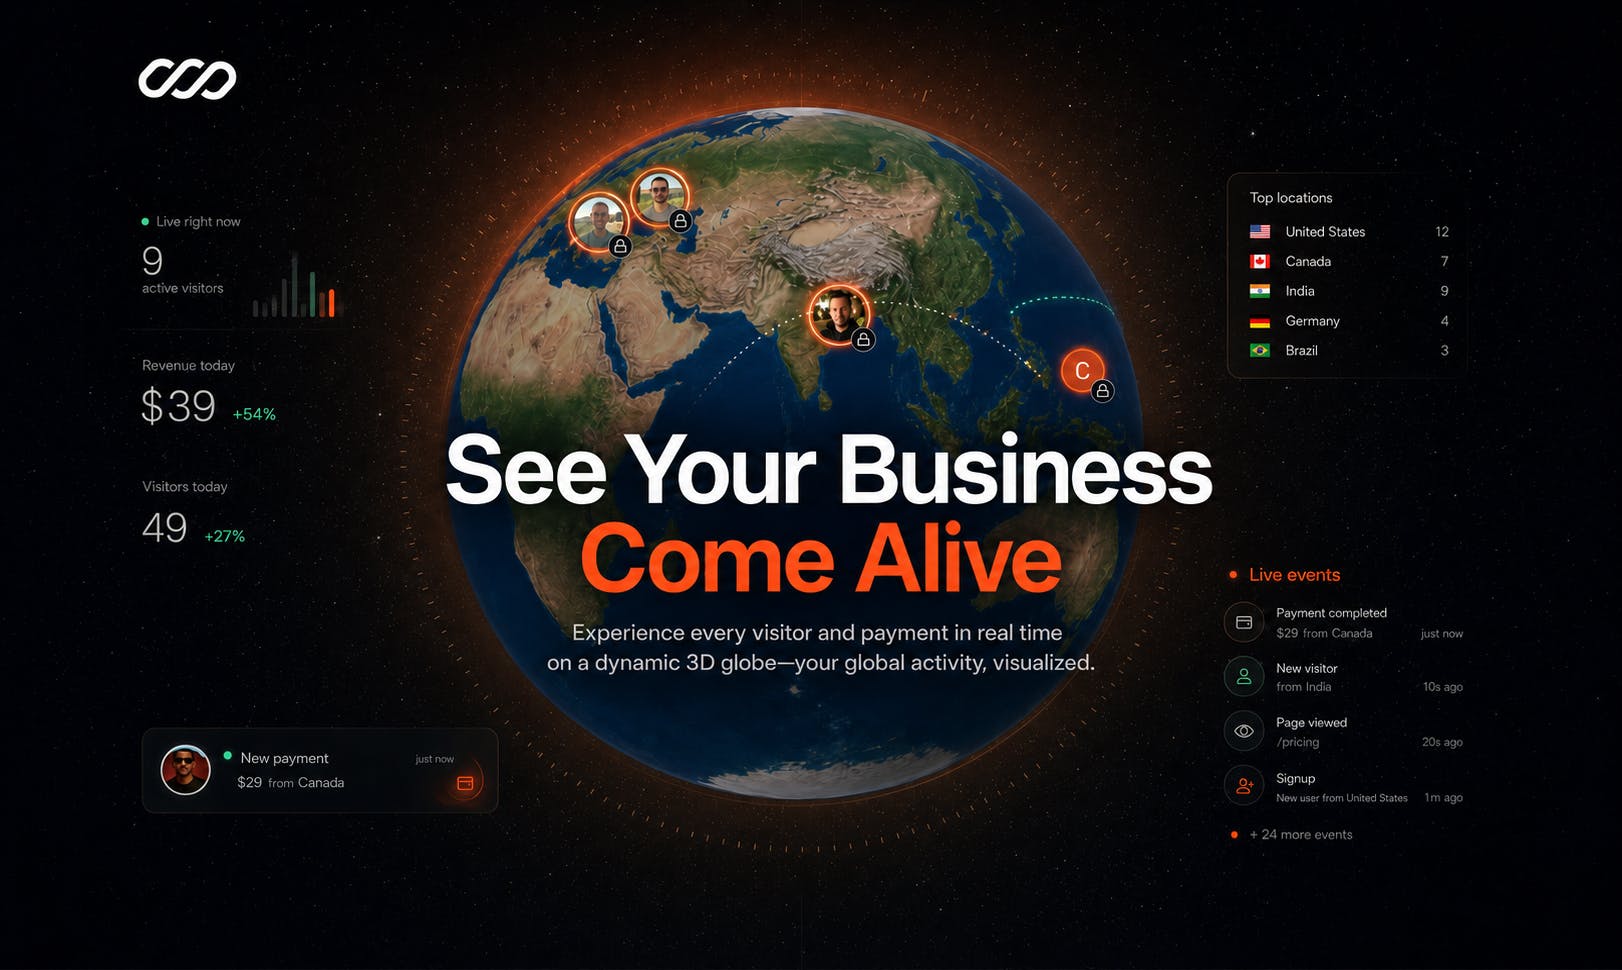
Dashi Metrics Core Philosophy: Bringing Revenue Data to Life
Dashi's tagline "Visualize your revenue on a 3D globe" hits the nail on the head. Its core concept is transforming static reports into dynamic geographic visualizations: every visitor and every payment is marked in real-time on the globe's surface.
From a technical implementation perspective, 3D globe visualization isn't an entirely new concept—its foundation traces back to the maturation of browser-based 3D rendering technologies like WebGL and Three.js. In recent years, open-source libraries such as Cesium, Deck.gl, and Globe.gl have enabled developers to achieve high-performance globe rendering and data overlay within browsers. The core challenge with this technology lies in maintaining smooth interactivity while handling large volumes of real-time data points—each data point must pass through geocoding (converting IP addresses or payment addresses to latitude/longitude coordinates), projection transformation (mapping spherical coordinates to screen pixels), and animation rendering, among other computational steps.
From Static Charts to Real-Time Geographic Mapping
For SaaS teams and founders targeting global markets, "where are our customers" and "which regions are growing" are critically important questions. Global SaaS products face unique data challenges: users span dozens of time zones, payment methods range from credit cards to local payment systems to cryptocurrency, and user behavior patterns, willingness to pay, and churn rates can vary significantly across regions. Traditional aggregate metrics (such as Monthly Recurring Revenue/MRR and Customer Acquisition Cost/CAC) are important but obscure geographic nuances. For example, a 5% global MRR growth might mean the North American market is plateauing while Southeast Asia is exploding—this kind of insight is crucial for product internationalization strategy.
Traditional dashboards typically require drilling down through filters and data tables layer by layer to see geographic distribution, while Dashi directly presents this information on a rotatable, zoomable, interactive 3D globe. Users can explore real-time activity across continents and countries as easily as spinning a desktop globe.
The value of this presentation goes beyond just looking good. The geographic dimension naturally carries implicit information about time zones, market maturity, and regional marketing effectiveness. When a payment "lights up" on the map, founders can perceive their business's pulse in a more intuitive way. From a cognitive science perspective, this leverages the human brain's natural ability to process spatial information. Research shows that spatial memory is one of humanity's most powerful memory systems—we more easily remember spatial patterns like "that region in Brazil is growing rapidly" than abstract numbers like "South American MRR grew 23% month-over-month."
The Differentiating Advantage of Interactive 3D Experience
Dashi's emphasis on "Spin, zoom, interact" is what sets it apart from ordinary BI tools. It transforms data consumption from "reading" into "exploring," lowering the barrier to understanding. For founders who need to present a business panorama to investors or team members, a dynamic globe is clearly more compelling and persuasive than a static screenshot.
Target Users and Use Cases
From a product positioning standpoint, Dashi Metrics primarily targets SaaS teams and indie founders. These users share several common characteristics:
- Their business typically serves a global audience, with users from multiple countries and regions;
- They are highly focused on revenue, conversion, and growth trends;
- They seek efficient, intuitive insights rather than complex data analysis workflows.
In practice, Dashi may be well-suited for the following scenarios:
- Real-time monitoring: Tracking global payment activity and instantly spotting anomalies or spikes;
- Team presentations and pitches: Using a dynamic globe to present a data panorama during meetings or fundraising demos;
- Market insights: Quickly identifying growth signals in emerging markets;
- Office ambient displays: Serving as a continuously running business visualization screen that keeps the team connected to business performance.
A Sober Assessment: The Capability Boundaries of 3D Visualization
While the 3D globe presentation is quite appealing, a rational evaluation of its limitations from a professional standpoint is necessary.
Flashy Doesn't Always Mean High Decision-Making Value
Visual impressiveness and decision-making value don't always correlate. Geographic mapping works well for displaying distribution-type information, but for scenarios requiring precise numerical comparisons, time-series trends, or multi-dimensional cross-analysis, traditional charts remain irreplaceable. Dashi is better suited as an "overview layer" rather than a "deep analysis layer."
It's worth noting that 3D displays also have inherent cognitive drawbacks: occlusion issues (data on the far side of the globe isn't visible), distance distortion (areas near the poles are compressed in spherical projection), and difficulty in reading exact values. This is a long-standing debate in the data visualization field—3D formats increase visual appeal while often sacrificing precision in information delivery.
Data Integration Is Key
Real-time mapping depends on the completeness and accuracy of data ingestion. Achieving true "real-time" geographic mapping requires an efficient data pipeline architecture behind the product. A typical workflow includes: receiving transaction events from payment platforms like Stripe or Paddle via Webhooks, associating transactions with specific geographic locations through geocoding services (such as MaxMind's GeoIP database), and then pushing data to the frontend in real-time via WebSocket or similar persistent connection technologies for rendering. Latency at any stage affects the final "real-time feel." Additionally, privacy regulations like GDPR impose compliance requirements on how user geographic data is processed.
Whether the product can seamlessly integrate with data sources from payment systems like Stripe and analytics tools will directly determine its practical utility. Currently, publicly available information doesn't detail its integration capabilities in depth—this is something potential users need to verify carefully.
Can Novelty Convert to Daily Essential Use?
From a long-term usage perspective, whether "novelty" can convert into "daily essential use" is a common challenge facing this type of visualization product. Globe displays are great for demos and sharing, but whether teams will continuously rely on them for daily operations depends on whether the product can offer more practical features like filtering, alerts, and comparisons.
Summary: Data Deserves to Be Seen Better
Dashi Metrics represents an interesting direction in the data visualization space—presenting business data with greater immersion and spatial awareness. For global SaaS teams, it offers a fresh perspective of "seeing your business flow across the world," with particular value in presentation and overview scenarios.
Of course, whether it can evolve from an "eye-catching display tool" into an "indispensable analytics platform" will require continued refinement in data integration depth, analytical capabilities, and long-term practical utility. But regardless, the emergence of products like this reminds us: data doesn't just need to be computed—it deserves to be seen better.
Related articles

Python 3.15 New Feature: Is the sentinel Type Better Than None?
Python 3.15 adds the sentinel type, using named unique sentinel objects to replace None and bare object(), resolving confusion among missing values, explicit emptiness, and invalid input while avoiding type hint failures.

Deep Learning's Three Architectures and the Universal Approximation Theorem: A Complete Guide to MLPs, CNNs, and Transformers
Explaining the inductive bias differences among MLP, CNN, and Transformer, the existence meaning of the Universal Approximation Theorem (UAT), and the role of Taylor expansion in approximation analysis, while clearing up common misconceptions.

GitLab Emergency Patch Release: Analysis of Critical Security Fixes
GitLab releases critical patch 19.5.1, sparking 355 points of discussion on Hacker News. This article analyzes the background, upgrade steps for self-hosted instances, and verification points to help DevOps teams respond quickly to security updates.