Data Science Job Search: How ML and SQL Projects Make Your Resume Stand Out

Stand out in data science hiring with unique ML and SQL projects that go beyond tutorial-level work.
Data science job seekers can differentiate themselves by avoiding overused tutorial datasets and instead building two deep projects: an ML project with a complete pipeline from data to deployment, and a SQL project demonstrating real data modeling and complex query skills. This article provides specific project directions, free dataset recommendations, and strategies for leveraging full-stack and visualization skills to impress recruiters.
Why Your Resume Projects Need to Be "De-Templated"
In the data science and machine learning job market, recruiters face hundreds or even thousands of resumes every day. When a hiring manager sees "Titanic Survival Prediction," "Iris Flower Classification," "House Price Prediction," or "Flight Price Prediction" for the umpteenth time, these projects not only fail to add value—they actually send a signal: this candidate merely copied a tutorial and lacks the ability to independently solve real-world problems.
The root cause of this "template syndrome" lies in the explosive growth of online education platforms. Introductory courses on Coursera, Udemy, DataCamp, and similar platforms almost universally use these classic datasets as teaching examples—they're small in scale, cleanly structured, and clearly labeled, making them ideal pedagogical tools. But when tens of thousands of students directly transfer their coursework to their resumes, these projects completely lose their ability to differentiate candidates. Based on feedback from multiple hiring managers on social media, their first reaction upon seeing such projects is typically to skip past them rather than dig deeper.
This is exactly the core dilemma raised by a job-seeking graduate on Reddit. His background was actually quite solid—proficiency in Power BI, Excel, SQL, some Python, and basic full-stack development skills (HTML, Tailwind, JS, Supabase). He'd even deployed a functional web portal for a client. But he clearly recognized: to win in the competition for Data Analyst / Data Scientist / ML / SQL positions, your resume must showcase projects that demonstrate real engineering capability, not just "running a few SELECT statements on a Kaggle CSV."
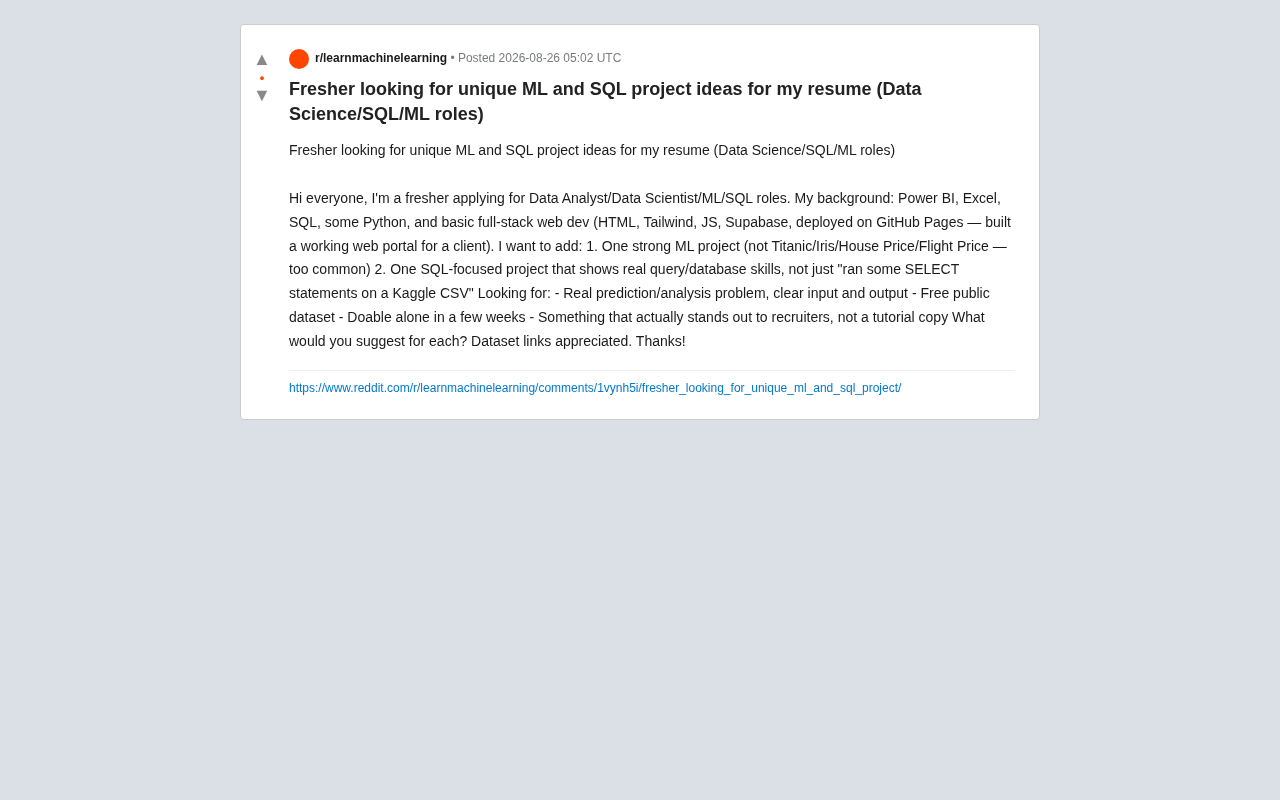
His requirements were very specific: a compelling ML project (avoiding overused datasets), a SQL project that demonstrates real database/query capabilities, using free public datasets, completable independently within a few weeks, and genuinely impressive to recruiters. This article addresses both directions with an actionable framework for project selection and methodology.
How to Design an Anti-Template ML Resume Project
Three Criteria for Evaluating ML Project Value
An ML project that catches a recruiter's eye typically meets three conditions:
First, the problem itself has clear business meaning. Recruiters don't care whether you can call RandomForestClassifier—they care whether you can transform a vague real-world problem into well-defined inputs, outputs, and evaluation metrics. Here's a key fact to understand: in actual industrial settings, choosing which model to use is only a small part of the entire machine learning pipeline. Data understanding, feature engineering, evaluation metric selection, model monitoring, and iteration typically account for over 80% of the work. What recruiters are wary of are resume projects that only showcase "three lines of code calling a model" while ignoring the upstream and downstream stages.
Second, the data requires meaningful cleaning and feature engineering. A ready-made clean dataset is actually a negative signal because it conceals the most time-consuming and skill-revealing aspects of data science work. Third, results are explainable and evaluable. You need to articulate why the model works, where errors come from, and how it could be further optimized.
Recommended ML Project Directions
Given the constraint of "completable independently within a few weeks" for graduates, the following directions balance uniqueness with feasibility:
Energy and Power Consumption Forecasting: Use publicly available electrical load or household power consumption datasets (such as UCI's Individual Household Electric Power Consumption) to build time series forecasting models. This direction naturally involves time series feature engineering and seasonal decomposition, demonstrating more depth than static classification problems.
Time series forecasting differs fundamentally from classification/regression tasks on static tabular data: data points have temporal dependencies, meaning you cannot simply randomly split training and test sets (you must split chronologically to avoid data leakage). Seasonal decomposition (such as STL decomposition) breaks a time series into trend, seasonality, and residual components, helping understand cyclical patterns in the data. Common feature engineering techniques include lag features, rolling statistics, and Fourier features for encoding periodicity. For model selection, everything from traditional ARIMA and Prophet to gradient boosting-based LightGBM and even deep learning Transformer architectures has applicable use cases. This rich space of technical choices itself allows the project to demonstrate greater depth.
Ride-sharing/Urban Data: Many cities (such as New York and Chicago) have released taxi and bike-sharing trip data. You can build demand forecasting (order volume for a given area and time slot) or anomaly detection. The data is large-scale, closely mirrors real business scenarios, and virtually no one uses it for "tutorial-level" projects.
Customer Churn or Behavior Prediction: Public datasets from telecom and banking (such as Telco Customer Churn) are common, but if you incorporate SHAP explainability analysis, cost-sensitive threshold optimization, or propose intervention strategies grounded in business logic, you can clearly differentiate yourself from ordinary implementations.
SHAP (SHapley Additive exPlanations) is a model interpretation framework based on Shapley values from game theory, proposed by Scott Lundberg at the University of Washington in 2017. Its core idea is to quantify each feature's contribution to a model prediction as a numerical value, such that all feature contributions sum to the difference between the model's prediction and a baseline value. Compared to traditional feature importance rankings, SHAP provides instance-level explanations—you can articulate exactly which features pushed a specific user's churn probability up or down. In practice, this explainability directly determines whether analytical results can be adopted by business teams and translated into action plans.
Cost-sensitive threshold optimization addresses another real-world problem: in binary classification, models default to a 0.5 decision threshold, but the costs of false positives and false negatives are often asymmetric. For example, missing a high-value customer who's about to churn (false negative) may cost far more than sending a retention offer to someone who wouldn't have churned anyway (false positive). Adjusting the decision boundary to minimize total business cost, rather than simply maximizing accuracy, demonstrates exactly the kind of business acumen recruiters want to see.
Vertical Applications of Text/Review Sentiment Analysis: Don't do generic "movie review sentiment classification." Instead, focus on a specific domain—for example, analyzing real user feedback for a particular product category and producing a visualized insights report. This naturally integrates existing Power BI skills.
Key Actions That Make ML Projects Stand Out
What truly makes a project stand out is often not the model itself, but the engineering and narrative around it: walk through the entire pipeline from data acquisition, cleaning, feature engineering, modeling, evaluation, to deployment; clearly document your thought process and trade-offs in the README; if you can deploy the model as a simple web application (entirely feasible for someone with full-stack experience using Supabase + GitHub Pages), then what recruiters see is not a script, but a complete product.
Supabase is an open-source Firebase alternative providing PostgreSQL databases, real-time subscriptions, authentication, storage, and edge functions as Backend-as-a-Service (BaaS). For data science job seekers, its core value lies in offering a free hosted PostgreSQL instance that can serve simultaneously as a project's data storage layer and API layer. Combined with free frontend hosting services like GitHub Pages or Vercel, job seekers can expose ML model predictions through RESTful APIs at zero cost, building a complete end-to-end application. This "data science + engineering deployment" combination is extremely rare among graduates and effectively communicates a candidate's ability to push models from notebooks into production environments.
How to Design a SQL Project That Demonstrates Real Capability
Moving Beyond "SELECT * FROM csv"
Many job seekers' so-called SQL projects essentially just import a CSV into a database and run a few queries. This fails to demonstrate genuine database capability. What recruiters want to see is: can you design reasonable table structures, handle multi-table relationships, write complex queries, and demonstrate basic awareness of performance?
Start SQL Projects with Data Modeling
A high-quality SQL project should begin with designing a normalized relational database. For example, based on publicly available e-commerce, movie rating (such as the MovieLens dataset), or public transportation data, design a multi-table structure including user tables, product/content tables, and transaction/rating tables with clearly defined primary keys and foreign key relationships. This step alone already separates you from those who can only write SELECT statements.
Database normalization is the core theory of relational database design, aimed at eliminating data redundancy and update anomalies. The most commonly referenced are the first three normal forms: First Normal Form requires that each column's values are atomic (indivisible); Second Normal Form requires that non-key columns are fully dependent on the primary key (eliminating partial dependencies); Third Normal Form requires no transitive dependencies among non-key columns. In practice, over-normalization can lead to excessive JOIN operations during queries, so there's a trade-off between normalization level and query performance. Being able to demonstrate this design decision-making process in a resume project—why you chose a particular table structure, what denormalization trade-offs you made—demonstrates database engineering capability far better than simply showcasing query statements.
Demonstrating Depth and Complexity in SQL Queries
On top of the data, write queries that reflect real business analysis capability, such as:
- Window functions: Calculate cumulative spending, rankings, year-over-year and month-over-month changes;
- CTEs (Common Table Expressions): Break complex logic into readable multi-step queries;
- Aggregation and grouping: Multi-dimensional retention analysis, funnel analysis, RFM user segmentation;
- Subqueries and correlated queries: Find "users whose spending exceeds their city's average"—problems requiring nested logic.
Window Functions are a powerful class of SQL tools that perform aggregate calculations without reducing the number of result rows, defining the calculation window through the OVER clause. Common window functions include ROW_NUMBER(), RANK(), and DENSE_RANK() for ranking, LAG() and LEAD() for accessing previous/next row data, and SUM() OVER() and AVG() OVER() for cumulative or moving calculations. In business analysis, window functions elegantly implement year-over-year growth rate calculations (using LAG to access the same period last year), cumulative spending trajectories across a user's lifecycle, and various ranking and percentile analyses. Mastering window functions is widely regarded as the dividing line between junior and intermediate SQL capability.
CTEs use the WITH keyword to define temporary named result sets, allowing complex queries to be built step by step like building blocks, dramatically improving readability and maintainability. RFM analysis is a classic user segmentation method based on three dimensions: Recency (how long since the last purchase), Frequency (purchase frequency), and Monetary (purchase amount). By scoring each dimension and combining them, users can be classified into groups such as high-value loyal customers, at-risk-of-churning customers, and low-activity customers. Implementing RFM analysis with CTEs is excellent resume project material because it simultaneously demonstrates SQL technical capability and business analysis thinking.
If conditions allow, demonstrate query performance comparisons before and after index optimization on larger datasets—this will make your SQL skills appear exceptionally solid. Database indexes are similar to a book's table of contents—they create a data structure (typically a B-tree or B+tree) that allows the database engine to quickly locate target rows without scanning the entire table. In projects, you can use EXPLAIN or EXPLAIN ANALYZE commands to view query execution plans, comparing scan methods (Sequential Scan vs Index Scan) and execution times before and after adding indexes. It's important to note that more indexes aren't always better—they consume additional storage space and reduce write performance. Being able to explain in what scenarios indexes should be created and on which columns (high-selectivity columns, columns frequently appearing in WHERE/JOIN/ORDER BY clauses) demonstrates a deep understanding of database internals.
Combining SQL Projects with Power BI Visualization
For job seekers proficient in Power BI, an ideal combination is: use SQL for data modeling and complex queries, then connect query results to Power BI to generate interactive dashboards. A single project like this covers both "database engineering" and "data visualization/analysis" tracks simultaneously, making it extremely compelling for Data Analyst positions.
Recommended Free Public Datasets
The following are widely available in the community and suitable for "non-template" projects:
- UCI Machine Learning Repository: Classic but contains many lesser-known, high-quality datasets;
- City open data platforms (NYC Open Data, Chicago Data Portal, etc.): Real, large-scale, frequently updated;
- Kaggle Datasets: Be sure to select lesser-known datasets and avoid overused beginner sets;
- Google Dataset Search: Cross-platform search for specific topics;
- Government and public institution data (such as data.gov): Ideal for social, economic, and public health analyses.
Action Items for Data Science Graduates
For graduates preparing their resumes, the most effective strategy isn't stacking up project quantity, but rather going deep on two projects: one ML project that completes the full cycle from "data to deployment," and one SQL project that demonstrates real capability from "data modeling to business analysis."
More importantly, leverage your existing differentiating advantages. Full-stack deployment experience and Power BI skills are actually rare among candidates with purely algorithmic backgrounds. Deploying an ML model as a web application and turning SQL query results into interactive dashboards directly presents the combined value of "engineering capability + analytical capability" to recruiters.
Finally, don't forget to tell a good story. In your resume and GitHub README, clearly explaining "what real problem you solved, why you approached it this way, and what the results were" is far more compelling than listing which libraries you used. A project's value is ultimately determined by the depth of your thinking, not the tools themselves.
Key Takeaways
Related articles

Chain of Thought Isn't Just for AI: How Humans Can Use CoT to Improve Thinking Quality
Chain of Thought isn't just a prompt trick for large models. Starting from a Hacker News discussion, this article analyzes why CoT works for human thinking too, breaks down actionable ways to transfer it, and highlights the key differences between human CoT and machine CoT.
Cloudflare Teams Up with OpenAI: Closi…
Cloudflare Teams Up with OpenAI: Closing the Loop from Vulnerability Discovery to Defense with AI
Cloudflare uses OpenAI Daybreak to investigate security vulnerabilities and generate reviewable remediation plans, while developers use Codex to boost coding efficiency and quality.

Orca Multi-Agent Orchestration in Practice: A Guide to Parallel Collaboration with Claude and Codex
Orca is Stable AI's free open-source agent workbench supporting 34 agents like Claude Code and Codex in parallel. Learn its Git worktree isolation, multi-model orchestration, and mobile management.