Datastory: Turning Data into Stories Worth Sharing with AI

Datastory combines AI generation, no-code charting, and open datasets into one data storytelling platform.
Datastory is a no-code data visualization platform that recently ranked #10 on Product Hunt, designed to help "data storytellers" create interactive charts, web pages, and reports without writing code. Its three core capabilities include no-code interactive content creation, AI-assisted narrative generation from raw data, and a built-in open dataset catalog. Target users range from data journalists and marketing teams to policy communicators — anyone with storytelling needs but limited engineering resources. Its key differentiator is integrating data access, AI generation, and content publishing into a single closed loop rather than acting as just another charting tool. The product is still early-stage, and output quality and data coverage remain to be validated.
A New Approach to Data Visualization: No-Code + AI
In the age of information overload, the real challenge is no longer getting data — it's telling a compelling story with it. Datastory, which recently debuted at #10 on Product Hunt, is squarely aimed at this pain point. The platform positions itself as a "no-code platform for data storytellers," built around a simple yet powerful tagline: Turn the world's data into stories worth sharing.
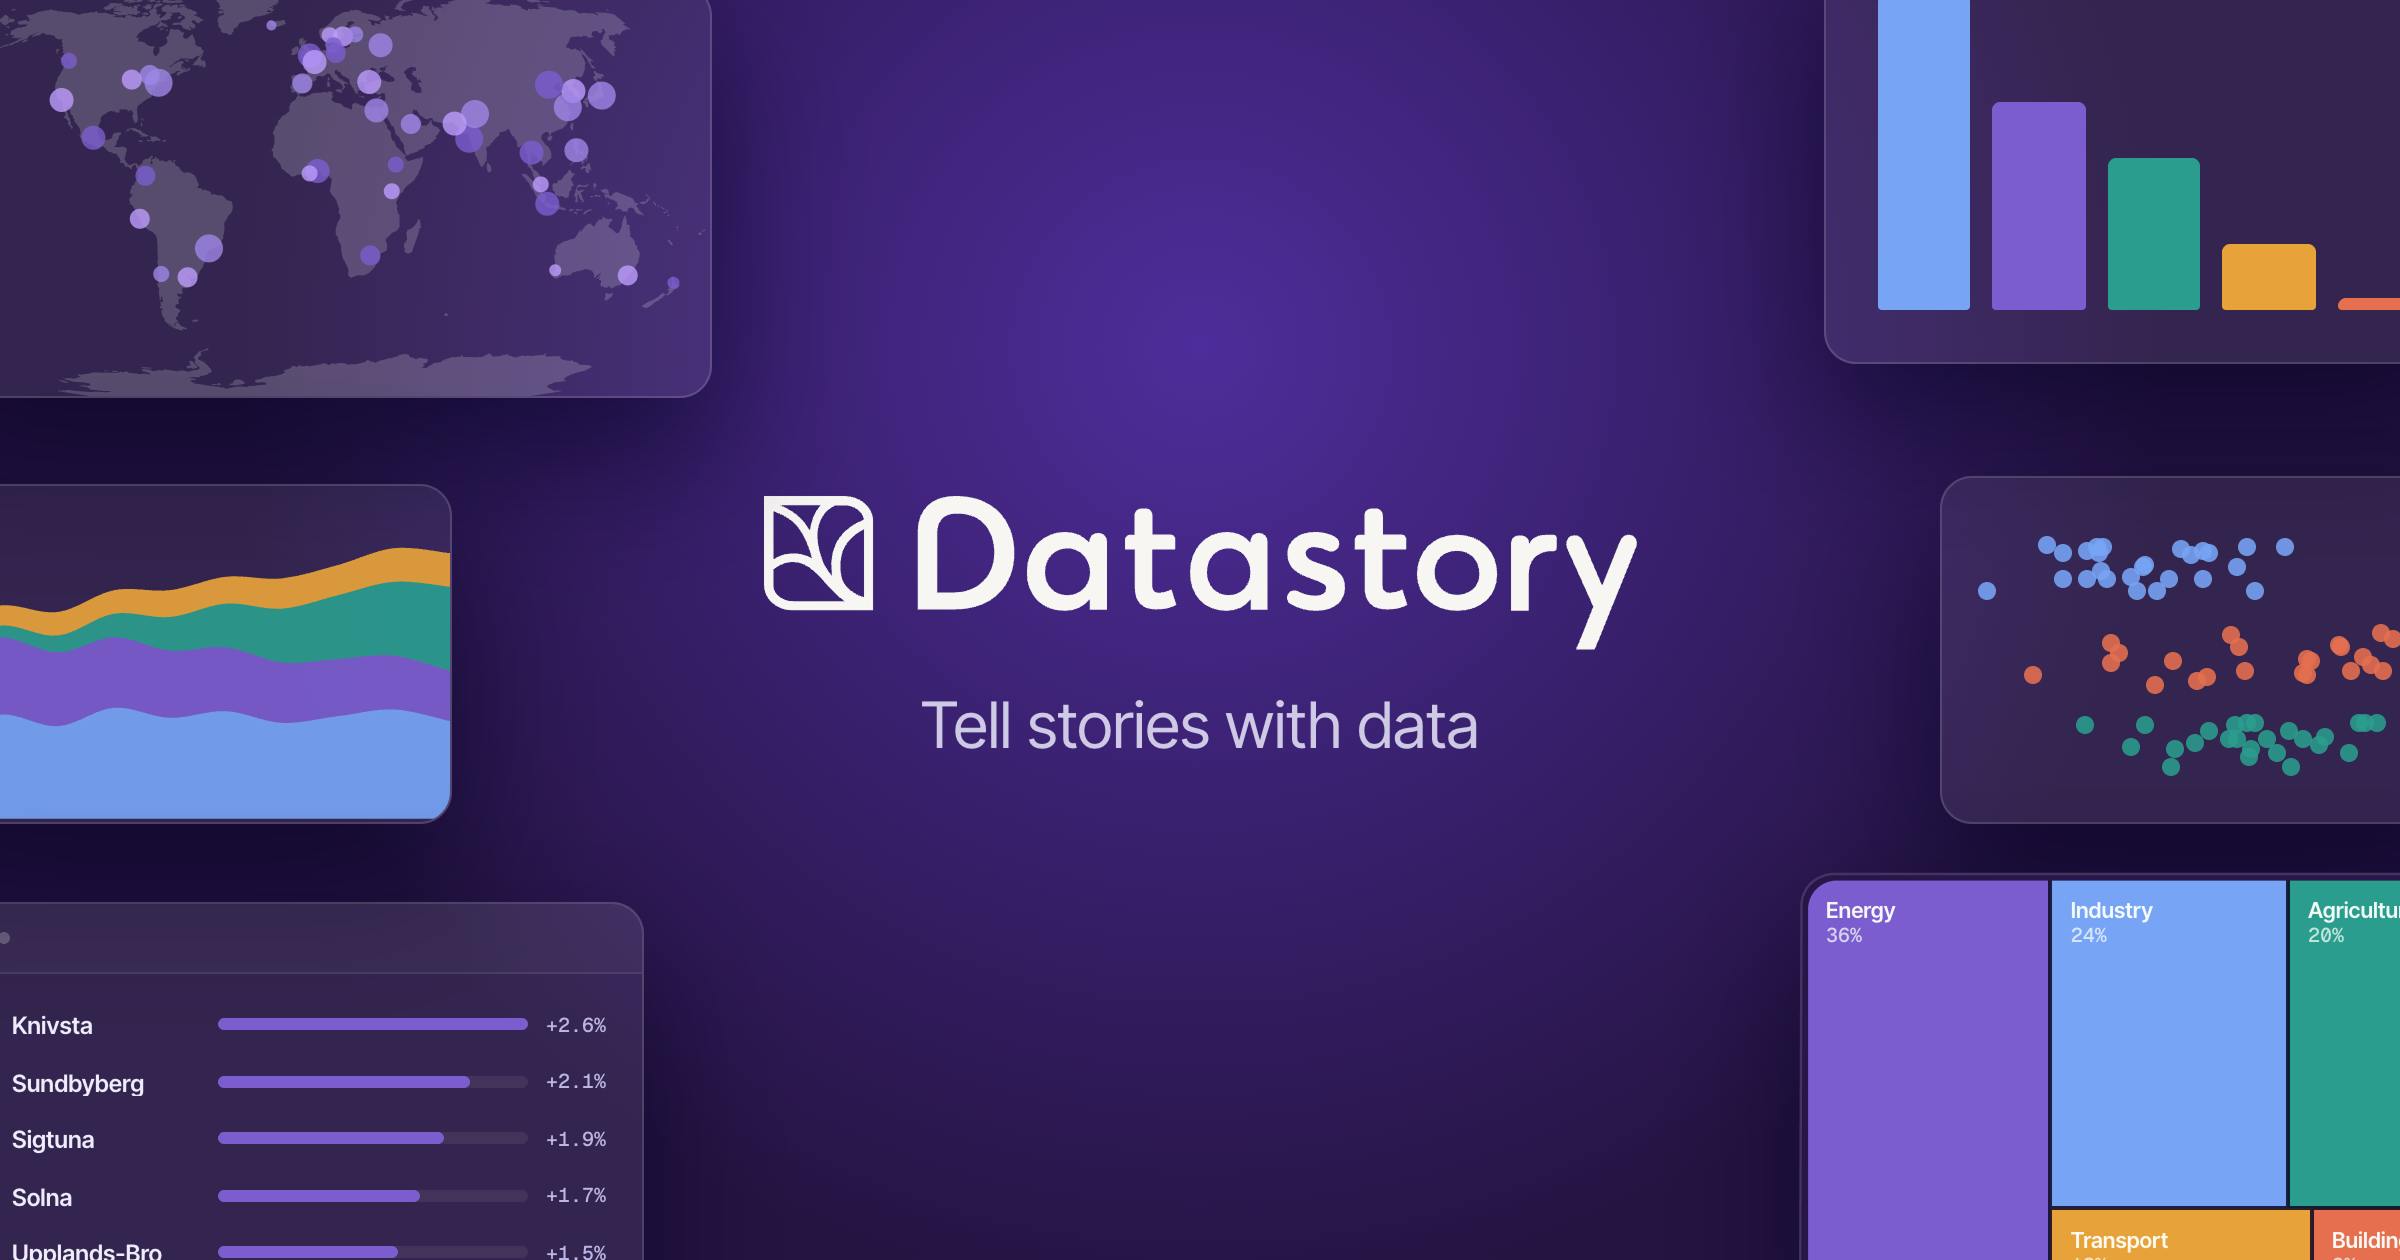
The product has garnered 87 upvotes and 2 comments on Product Hunt, and is categorized under Artificial Intelligence, Data Analytics, and Data Visualization. While the numbers suggest it's still in its early days, the underlying product philosophy — embedding AI generation capabilities throughout the data storytelling workflow — is worth paying attention to.
What Datastory Actually Does
According to official documentation, Datastory's core capabilities fall into three areas:
Interactive Charts and Reports
Users can create interactive charts, web pages, and reports without writing a single line of code. This means journalists, analysts, policy researchers, and everyday content creators can bypass the complexities of front-end development or BI tool configuration and go straight to publishing interactive, shareable outputs. Compared to static Excel charts or custom dashboards that require developer resources, this "out-of-the-box" approach dramatically lowers the barrier to entry.
AI-Assisted Creation
Datastory weaves AI into the creative workflow, helping users rapidly generate charts, websites, and reports from raw data. For users unfamiliar with data visualization design principles, AI can handle the translation from data to narrative — reducing the time spent on trial-and-error adjustments. This is what sets it apart from pure charting tools: it's not selling "chart drawing," it's selling "story telling."
Open Dataset Catalog
The platform also includes a continuously growing catalog of open datasets. This is a notably thoughtful touch: most data visualization tools require users to bring their own data, but Datastory proactively provides data sources so users can dive straight into analysis and creation. For creators who lack proprietary data, this solves the classic "great chef, no ingredients" problem.
Who Needs a Tool Like This?
Data storytelling is a cross-disciplinary need that spans journalism, consulting, public policy, and marketing. Traditionally, a high-quality data report requires collaboration between a data analyst, a visualization designer, and a front-end engineer. Datastory aims to compress that entire pipeline into a single person on a single platform, through the combination of no-code tools, AI, and open data.
Typical target users include: data journalists and independent content creators; marketing and growth teams that need to produce insight reports quickly; policy communicators in the public sector and NGOs; and small-to-medium businesses looking to make their pitches more persuasive through visualization. What these groups have in common is that they have storytelling needs — but not necessarily engineering resources.
Data Storytelling, as a professional discipline, emphasizes combining data analysis results with narrative structure and visual design so that audiences can intuitively grasp the meaning behind the data and the actions it implies. It differs from pure Data Visualization — the latter focuses on "drawing the data," while the former is more concerned with "what the data means, why it matters, and what to do about it." Research firms like Gartner have consistently identified Data Literacy as one of the top skill gaps in organizations, and data storytelling is a critical piece of closing that gap. Traditionally, this capability has been highly dependent on human judgment and cross-disciplinary expertise — which is precisely why AI intervention holds the most disruptive potential here.
What Datastory Reveals About Industry Trends
Datastory's emergence isn't an isolated event — it's one wave in the broader tide of AI reshaping productivity tools. Over the past year or more, AI has been redefining content creation tools across the board: documents, slide decks, design, code. Data visualization is no exception. AI is automating what was once a highly experience-dependent process: understanding the data → selecting the right chart type → organizing the narrative logic.
Datastory's decision to embed an open data catalog into the platform is a differentiation move worth noting. It's not just a generation tool — it's building a closed loop of "data + generation + publishing." If that open data ecosystem continues to grow, its moat won't just be ease of use; it'll be the data assets themselves.
The competitive landscape in the data visualization tools market is crowded. Mature BI tools like Tableau, Power BI, and Looker dominate the enterprise segment; lightweight tools like Flourish and Datawrapper have established strong reputations in media and journalism; while Observable and Vega-Lite serve data practitioners with some coding ability. Datastory's differentiated angle is combining AI generation with an open data catalog to target users who have neither data nor technical skills — a gap that most existing tools leave largely unaddressed. But precisely because of this positioning, it needs to hit the mark on data quality, AI narrative accuracy, and ease of use simultaneously. A weakness in any one of these areas could hurt user retention.
A Cautiously Optimistic Assessment
To be objective: based on publicly available information, Datastory is still in its early promotional stage. Its 87 upvotes represent a mid-tier level of traction among comparable AI products. The actual quality of its generated outputs, the professionalism of its charts, the accuracy of its AI-driven narratives, and the breadth and freshness of its open dataset coverage all remain to be verified through real-world use.
It's also worth noting that the core value of data storytelling lies in insight, not aesthetics. Whether AI can genuinely help users uncover meaningful conclusions — rather than simply dressing up numbers in pretty charts — will ultimately determine the ceiling for tools like this.
For users who need to communicate with data but don't want to get bogged down in toolchain complexity, Datastory offers a low-barrier option worth exploring. Whether it can stand out in an increasingly crowded field of AI visualization tools will depend on continued product refinement and ecosystem development.
Related articles

Python 3.15 New Feature: Is the sentinel Type Better Than None?
Python 3.15 adds the sentinel type, using named unique sentinel objects to replace None and bare object(), resolving confusion among missing values, explicit emptiness, and invalid input while avoiding type hint failures.

Deep Learning's Three Architectures and the Universal Approximation Theorem: A Complete Guide to MLPs, CNNs, and Transformers
Explaining the inductive bias differences among MLP, CNN, and Transformer, the existence meaning of the Universal Approximation Theorem (UAT), and the role of Taylor expansion in approximation analysis, while clearing up common misconceptions.

GitLab Emergency Patch Release: Analysis of Critical Security Fixes
GitLab releases critical patch 19.5.1, sparking 355 points of discussion on Hacker News. This article analyzes the background, upgrade steps for self-hosted instances, and verification points to help DevOps teams respond quickly to security updates.