Global Forest Type Map: A New Understanding of Forests at 10-Meter Resolution

A 10-meter resolution global forest type map that pushes ecological assessment from area thinking to structural thinking.
The article introduces a mapping effort that classifies global land into forest types at 10-meter resolution, noting that traditional forest cover indicators cannot reflect internal structural differences—coniferous and broadleaf forests of the same area differ greatly in carbon sequestration, fire risk, and biodiversity. The 10-meter scale approaches actual forest patch size and can identify edges, corridors, and small remnants. The classification system must trade off detail against robustness, and multi-source remote sensing fusion is inevitable but introduces error propagation. The map serves carbon accounting, fire management, and conservation planning, especially revealing silent degradation where coverage is stable but types homogenize. The article also stresses its limitations: type labels are not tree species composition, single-date maps decay quickly, and it must be linked with ground surveys and change detection.
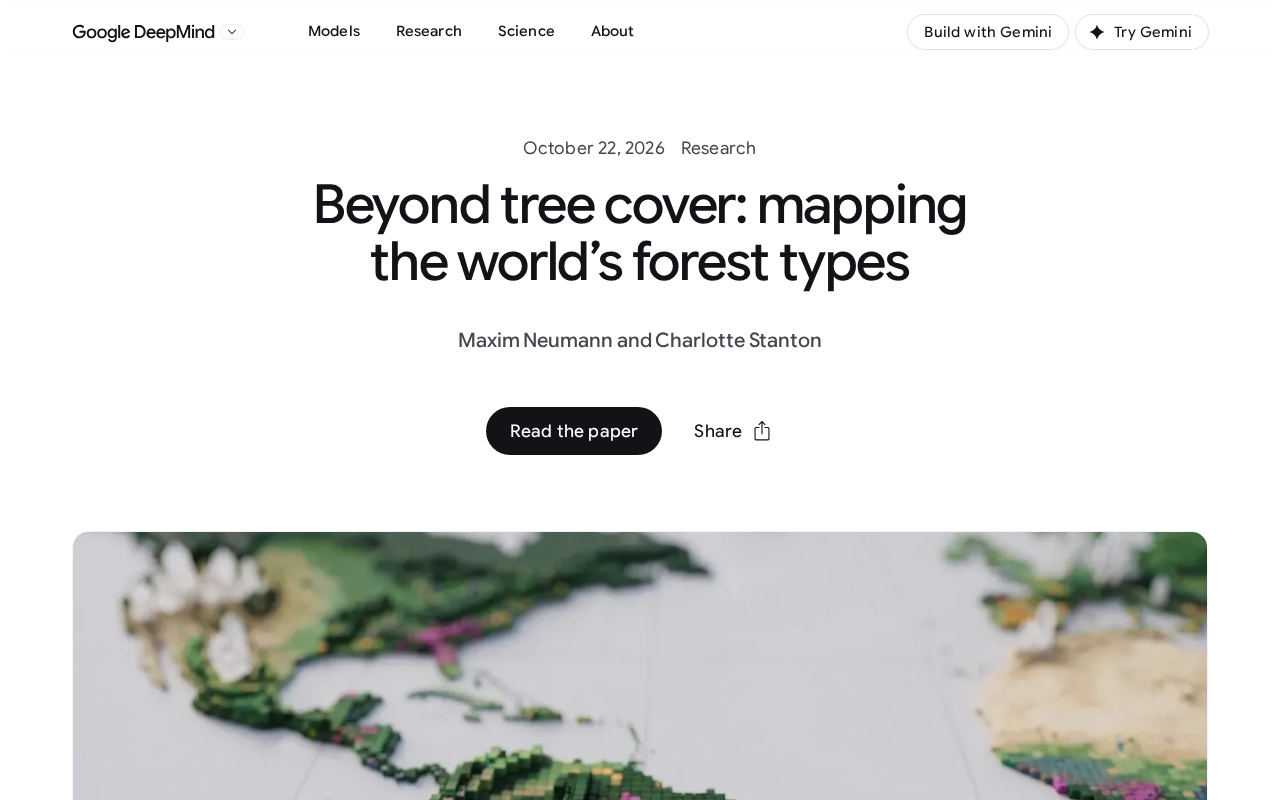
Forest cover figures are often treated as a core indicator of ecological health, but the gap between a plantation of a single species and a native mixed forest—in carbon sequestration capacity, biodiversity, and climate regulation—is far more than the two states of "trees" versus "no trees" can capture. A global forest type mapping effort is trying to change this crude way of observing—it assigns every 10-meter-by-10-meter patch of land on Earth's surface to a different forest type, turning "forest" from a vague label into a map that can be subdivided and compared.
From "Is There a Tree" to "What Kind of Forest"
Traditional remote sensing products mostly output forest cover percentage or biomass density, answering "how many trees are here." Forest type maps answer a different question: is this stand evergreen coniferous forest, deciduous broadleaf forest, or mixed forest, savanna-like open woodland? Their value lies in the fact that the ecological functions of forests depend heavily on type structure. Coniferous and broadleaf forests of the same area differ markedly in reflectance, water evapotranspiration, fire risk behavior, and species habitat capacity; using a single cover indicator for policy evaluation easily misjudges structural degradation as ecological improvement.
The 10-meter spatial resolution is the key parameter of this map. Most global land cover products have resolutions ranging from hundreds of meters to kilometers, where a single pixel often mixes farmland, shrubland, and woodland, and the type label can only take the dominant category, erasing information at boundary zones. The 10-meter scale approaches the actual scale of most forest patches, enabling forest edges, corridors, and small remnant forests to be identified individually—precisely the parts most sensitive in ecological connectivity analysis.
Synthetic Aperture Radar (SAR) and Light Detection and Ranging (LiDAR) are two types of active remote sensing technologies that are often confused. SAR emits microwaves and receives surface backscatter, with wavelengths typically from a few centimeters to several tens of centimeters; it can penetrate clouds and operate day and night, is sensitive to surface roughness and moisture content, and is therefore good at distinguishing farmland, water bodies, and features with large structural differences, but has limited ability to resolve spectral differences at the tree species level. LiDAR, by contrast, emits laser pulses and measures echo time, directly obtaining canopy height, vertical profiles, and ground elevation; it is a powerful tool for characterizing forest vertical structure, but its drawbacks are strip-based observation and high cost for globally uniform coverage. The two complement optical imagery: optics provide canopy spectral and phenological information, SAR ensures continuous observation in cloudy regions, and LiDAR calibrates structural parameters. The key difficulties in multi-source fusion lie in geometric registration, scale matching, and how errors propagate through the classification chain.
The Trade-offs Behind the Classification System
Dividing global forests into a finite set of types is essentially a taxonomic compromise. The more types there are, the more detailed the description, but the blurrier the boundaries between classes and the harder the validation; the fewer the types, the more robust the product, but the weaker its guidance for management decisions. Such maps usually need to combine dimensions such as climate zone, leaf habit (evergreen/deciduous), leaf form (needleleaf/broadleaf), and canopy density, with each combination corresponding to a set of interpretation rules and training samples.
The reliability of classification is also constrained by observation conditions. Optical imagery in cloudy tropical regions has long been plagued by cloud contamination; SAR can penetrate clouds but has limited ability to distinguish tree species; LiDAR can characterize canopy vertical structure but is difficult to cover uniformly worldwide. Multi-source data fusion is therefore an inevitable choice, but scale matching and error propagation between different sensors will be directly reflected in the confidence of the final types. If users treat the type map as deterministic truth without looking at the confidence layers, they are prone to overinterpretation in ambiguous boundary areas.
Leaf habit and leaf form are the two most fundamental dimensions in forest classification, but the two are often conflated. Leaf habit refers to evergreen versus deciduous, reflecting the seasonal strategy by which trees retain canopy leaves, directly linked to intra-annual photosynthetic activity rhythms and surface reflectance changes; leaf form refers to needleleaf versus broadleaf, reflecting leaf size, shape, and arrangement, associated with water use efficiency, light interception, and fuel characteristics. Crossing the two dimensions yields four basic combinations such as evergreen needleleaf and deciduous broadleaf; only by further overlaying canopy density (closure) and climate zone does a complete type system emerge. Notably, under the same leaf form, leaf habit may differ (e.g., evergreen broadleaf vs. deciduous broadleaf); remote sensing discrimination mainly relies on phenological time-series features rather than single-date imagery, which is also why classification requires multi-temporal data support.
Who Uses This Map
The direct users of forest type maps are widely distributed. Carbon accounting needs to distinguish afforestation, reforestation, and forest degradation; type information helps determine whether a change in a given plot is a structural transition or an area increase or decrease; fire management focuses on fuel types, and the fire behavior of coniferous and broadleaf forests differs significantly; biodiversity models require habitat structure parameters, and forest type is one low-cost surrogate variable among them.
For conservation planning, the significance of this map also lies in revealing areas where "coverage meets targets but types are homogeneous." A region's forest cover may remain stable for years, while internally mixed forests are gradually replaced by fast-growing pure plantations; the cover indicator shows no response, but the type map can capture this silent structural change. This is also the practical meaning of the phrase "beyond forest cover": coverage area is a necessary condition, not a sufficient one.
Forest degradation and deforestation are two concepts with different scopes in carbon accounting that are often confused in policy discussions. Deforestation refers to the conversion of forest area to other land uses (such as farmland or built-up land), manifesting as a direct decline in coverage; forest degradation refers to land that remains forest but whose structure or function has significantly declined, such as reduced canopy closure, decreased biomass, and simplified tree species composition, while coverage may remain unchanged. The carbon accounting frameworks of UNFCCC and IPCC require reporting the two separately, because carbon emissions from degradation may be long-term and hidden. When relying solely on cover indicators, degradation is almost invisible; forest type maps, by capturing type transitions (e.g., mixed forest becoming pure forest, closed forest becoming open woodland), provide structural-dimension evidence for degradation monitoring, which is also why they attract attention in mechanisms such as REDD+.
Limitations and Boundaries of Use
Such products cannot replace ground surveys. Type labels are a statistical generalization of canopy spectral and structural features, not equal to tree species composition, and certainly do not include forest age, health status, or understory information. In tropical rainforests, the separability of different tree species in canopy spectra is limited, and the explanatory power of classification results at the species level must be treated with caution. In the temporal dimension, a single-date map can only reflect the state at one point in time; the rate and direction of type transitions require overlaying multi-date products to determine.
Another practical constraint is update frequency. Forest types change due to logging, fire, pests and diseases, and succession, and the timeliness of a static map decays quickly. Embedding it into monitoring systems and linking it with change detection products has more long-term value than publishing a single map.
Assigning every 10-meter patch of land on Earth to a forest type—the weight of this work lies not in the resolution number itself, but in the fact that it pushes ecological assessment from area thinking to structural thinking. When policy targets still focus mainly on coverage, the type map offers a reminder: the quality of forests is written in their structure, not only in their area.
One-line Summary
A 10-meter resolution global forest type map that pushes ecological assessment from area thinking to structural thinking.
Paragraph Summary
The article introduces a mapping effort that classifies global land into forest types at 10-meter resolution, pointing out that traditional forest cover indicators cannot reflect internal structural differences—coniferous and broadleaf forests of the same area perform very differently in carbon sequestration, fire risk, and biodiversity. The 10-meter scale approaches the actual size of forest patches and can identify forest edges, corridors, and small remnant forests. The classification system must trade off between detail and robustness, and multi-source remote sensing fusion is inevitable but brings error propagation problems. The map can serve carbon accounting, fire management, and conservation planning, especially revealing silent degradation where coverage is stable but types are homogenizing. The article also emphasizes its limitations: type labels are not equal to tree species composition, the timeliness of a single-date map decays quickly, and it needs to be linked with ground surveys and change detection.
Related articles

Hands-On with the Gemini 4 Argon API: Thinking Levels and Background Mode Explained
A Free Code Camp crash course on the Gemini 4 Argon API: from getting a key and sending your first request to controlling reasoning costs with thinking levels, enabling multi-turn chat with previous_interaction_id, and generating a Breakout game in background mode—plus a Google engineer's take on the model's capabilities.

Reinforcement Learning Takes On Getting Over It: Distributed Training Strategies Behind 63% Progress
A developer uses deep reinforcement learning to tackle Getting Over It. The agent climbs from the bottom to 63% progress but gets stuck at the anvil. The project is open-sourced, using divide-and-conquer training and CPU-only training, seeking community collaboration to break the bottleneck.

Sigma FP2 Released: The World's Smallest Full-Frame Camera Gets Sensor and Screen Upgrades
Sigma launches the FP2 full-frame camera, retaining its smallest-and-lightest design with three key upgrades: improved sensor, articulating LCD screen, and longer battery life—built for portable video creators.