Hermes Agent Meets Grafana: A Practical Guide to AI Agent Observability

How Hermes Agent leverages Grafana to bring production-grade observability to AI agents.
As AI agents move into production, observability becomes essential. This article examines how Hermes Agent integrates with the Grafana ecosystem (Prometheus, Loki, Tempo) to monitor metrics, traces, and logs. It discusses why agent non-determinism demands robust observability, compares vertical LLM platforms like LangSmith with open standards like OpenTelemetry, and offers practical guidance for building stable, cost-controlled agent systems.
Introduction: AI Agents Need a Monitoring Dashboard Too
As AI Agents evolve from experimental toys into production systems, a long-overlooked question is rising to the surface: How do we actually know what an AI agent is doing? Which tools did it call? How many tokens did it consume? At which step did it get stuck? Is the response latency abnormal? In traditional software engineering, these questions are answered by mature observability systems — but in the AI Agent space, we're still in the early days.
The concept of observability originated in control theory, referring to the ability to infer a system's internal state from its external outputs. In software engineering, it differs fundamentally from traditional "monitoring": monitoring focuses on detecting known problems — you predefine alert rules and get notified when metrics exceed thresholds. Observability, on the other hand, is about exploring unknown problems — when a system exhibits behavior never seen before, can an engineer pinpoint the root cause using telemetry data alone? This distinction is especially important for AI Agents, because their failure modes are often unexpected: a model might produce a malformed tool call instruction, get trapped in a meaningless reasoning loop, or gradually drift from the user's intent during multi-step reasoning — none of which can be easily captured by predefined rules.
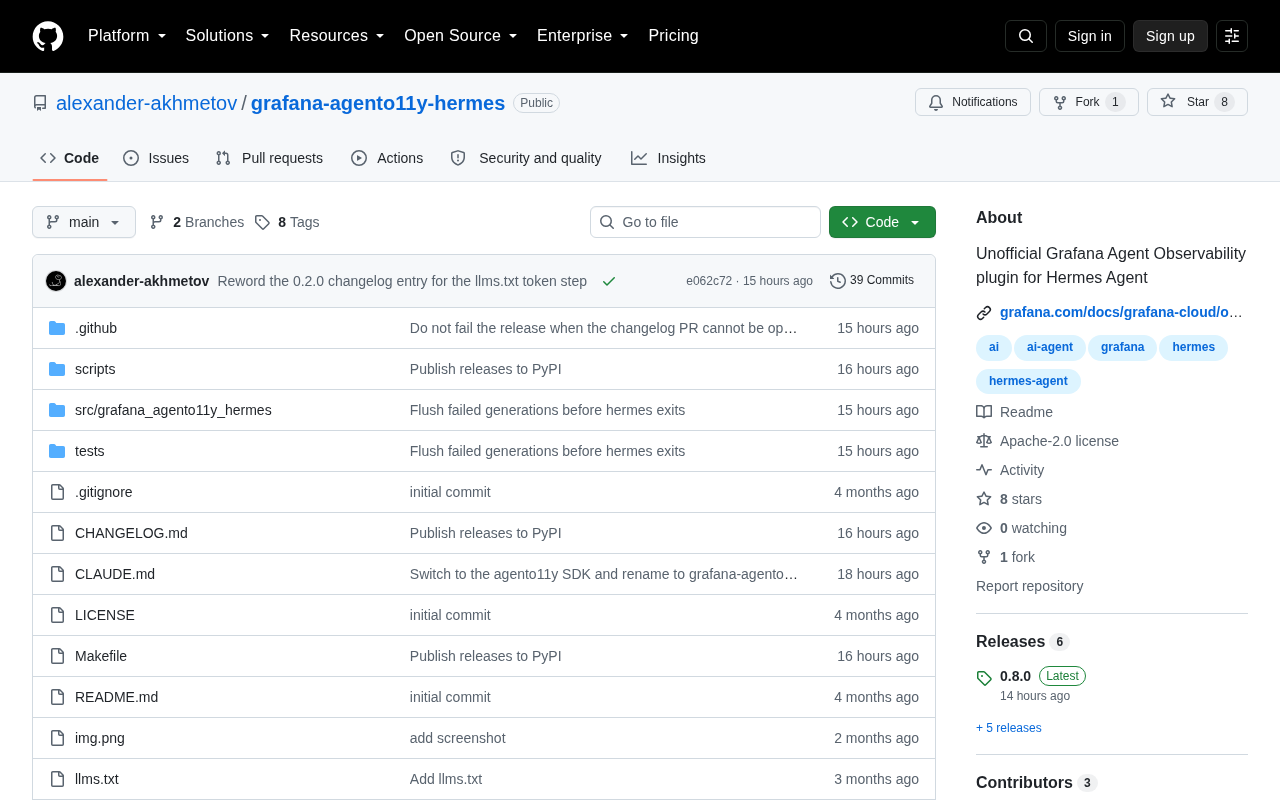
Recently, a project called Hermes Agent showcased its observability integration with Grafana on Hacker News (Show HN: Grafana agent observability for Hermes Agent). While the post didn't generate much buzz, it touches on a critical pain point in Agent engineering. This article explores why AI agents need observability and how mature tools like Grafana can play a key role.
Why AI Agents Need Observability
From "Black Box" to "Explainable"
Traditional deterministic programs produce the same output for the same input, and errors can be precisely located through logs and stack traces. AI agents, however, are inherently non-deterministic: the same prompt may trigger different reasoning paths, invoke different tools, and produce different intermediate results. This makes troubleshooting Agent systems extremely difficult when things go wrong.
The non-determinism of AI Agents stems from multiple levels. First, there's the sampling mechanism of large language models themselves: even with the same prompt, models introduce randomness during decoding through parameters like temperature and top-p, leading to potentially different outputs each time. Second, there's the compounding effect at the Agent architecture level: mainstream Agent frameworks (such as ReAct, Plan-and-Execute) use a "think-act-observe" loop, where each step's output serves as the next step's input. Small differences get amplified across multiple iterations — similar to the butterfly effect in chaotic systems. Furthermore, external tool calls introduce additional uncertainty: the same API may return different data at different times, and network latency or timeouts can alter the execution path. These factors combined mean that an Agent performing flawlessly in functional tests may exhibit completely unexpected behavior in production.
The core value of observability is making this "black box" transparent. By collecting key Metrics, Traces, and Logs during Agent execution, developers can reconstruct the agent's complete decision-making process and understand "why it did what it did."
Three Essential Needs in Production
In real production environments, Agent observability addresses three main categories of problems:
-
Cost Control: LLM calls are billed per token. A runaway Agent loop can burn through massive costs in minutes. Real-time monitoring of token consumption and call counts is the foundation of cost management. LLM pricing models typically charge separately for input and output tokens — for example, OpenAI's GPT-4o charges $2.50 per million input tokens and $10 per million output tokens. A seemingly simple Agent task may involve significant hidden token consumption: system prompts are resent in every conversation turn, tool call schema definitions occupy substantial context space, and conversation history grows linearly with each turn. Even more dangerous are so-called "Agent death loops" — when an Agent can't complete a task, it may repeatedly retry the same operation or bounce between two tools, consuming tokens with each cycle. Multiple industry cases have shown that an Agent without call limits can burn through hundreds of dollars in API fees within minutes. Therefore, real-time token consumption monitoring and automatic circuit-breaking mechanisms are essential safeguards for production Agents.
-
Performance Diagnosis: Agents often involve multiple rounds of LLM calls and external tool calls, with end-to-end latency potentially reaching tens of seconds. Distributed tracing helps pinpoint whether model inference is slow or a specific tool call is the bottleneck. In current mainstream Agent architectures, the influential ReAct (Reasoning + Acting) framework has the LLM alternate between reasoning and acting. A typical ReAct loop may include 5-15 LLM calls, each carrying the full conversation history and tool definitions, causing token consumption and latency to grow non-linearly with the number of steps. These complex execution topologies render traditional request-response monitoring completely ineffective. Only tracing systems capable of expressing nested call relationships (such as OpenTelemetry's Span tree structure) can clearly represent an Agent's execution process.
-
Quality Assurance: Monitoring failure rates, retry counts, abnormal terminations, and similar metrics enables timely detection of Agent behavior degradation, preventing production incidents from escalating.
Why Grafana Is an Ideal Platform for Agent Monitoring
A Mature Observability Ecosystem
Grafana is one of the most popular open-source observability platforms today, with a complete technology stack built around it — commonly known as the LGTM Stack: Loki (logs), Grafana (visualization), Tempo (traces), and Mimir (metrics, a cloud-native extension of Prometheus). The core design philosophy of this stack is "decoupling collection from storage": data is collected from applications through a unified agent (such as Grafana Alloy, formerly Grafana Agent) and then routed to the corresponding backend storage systems. Prometheus uses a pull model to periodically scrape /metrics endpoints exposed by applications, making it particularly suitable for aggregated time-series data. Loki borrows Prometheus's label indexing approach, indexing only log metadata rather than full text, significantly reducing storage costs. Tempo is a backend focused on distributed tracing, compatible with multiple data formats including Jaeger, Zipkin, and OpenTelemetry.
By choosing to integrate with Grafana, Hermes Agent can directly leverage this battle-tested infrastructure instead of reinventing the wheel. For operations teams, this also lowers the learning curve — they don't need to maintain a separate monitoring system for AI Agents but can incorporate Agent runtime data into their existing monitoring dashboards for unified management. The entire stack has been widely adopted by enterprises in Kubernetes environments, with reliability thoroughly validated.
The Trinity of Metrics, Logs, and Traces
An ideal Agent observability solution should cover the "three pillars":
- Metrics: Aggregated data such as requests per minute, average response time, token consumption rate, and tool call success rate — ideal for alerting and trend analysis.
- Traces: Complete records of an Agent task from receiving instructions to final output, including the duration and parameters of every LLM call and tool call.
- Logs: Fine-grained runtime details for deep-dive troubleshooting.
By correlating these three through Grafana, developers can drill down from macro trends to micro details — first spotting anomalies on a dashboard, then clicking into specific trace spans, and finally reviewing related logs to identify the root cause. Grafana's Explore feature plays a key role in this workflow: users can jump directly from an anomalous metric to the corresponding traces and logs for that time window, seamlessly linking all three signal types through TraceID and timestamps to form a complete troubleshooting loop.
Engineering Trends in Agent Observability
From Community Exploration to Industry Standards
The integration of Hermes Agent with Grafana represents an important shift happening in the AI Agent space: from focusing on "can we get it to run" to "can we run it stably, controllably, and maintainably." This is a necessary step on every technology's path to maturity.
In fact, multiple approaches to LLM application observability have emerged in the industry: there are vertical platforms built specifically for LLMs like LangSmith and Langfuse, as well as approaches like Hermes Agent's that embrace universal standards such as OpenTelemetry and Grafana.
LangSmith is a commercial LLM application development platform from the LangChain team, offering tracing, evaluation, prompt management, and dataset management features. Deeply integrated with the LangChain framework, it can automatically capture the input/output, latency, and token consumption of every step in a Chain. Langfuse is an open-source alternative supporting multiple frameworks including LangChain and LlamaIndex, with self-hosted deployment options. The advantage of these vertical platforms lies in their deep understanding of LLM-domain semantics — they natively support displaying traces by conversation turns, aggregating metrics by model version, and manual scoring of outputs, among other AI-specific workflows. However, their limitations are also apparent: when an Agent system needs to work alongside traditional components like databases, message queues, and microservices, these vertical tools can't provide a full-stack perspective. The Grafana + OpenTelemetry combination, on the other hand, can present AI component telemetry data alongside traditional infrastructure monitoring in a unified view.
Meanwhile, OpenTelemetry (OTel), the second most active project in the CNCF after Kubernetes, is providing a standardized foundation for AI Agent observability. It defines a language-agnostic telemetry data collection specification covering three signal types — Traces, Metrics, and Logs — along with SDKs and auto-instrumentation libraries for major programming languages. OpenTelemetry's key value lies in being "vendor-neutral": an application only needs to integrate the OTel SDK once and can send data to any compatible backend — whether open-source options like Grafana/Jaeger or commercial platforms like Datadog/New Relic. Notably, OpenTelemetry has already developed dedicated Semantic Conventions to describe LLM call characteristics, including standardized attributes like gen_ai.system (model provider) and gen_ai.usage.input_tokens (input token count). This means Agents built with different frameworks can produce structurally consistent telemetry data, greatly improving toolchain interoperability. The advantage of this approach lies in its openness and composability — adhering to open standards means data won't be locked into any specific vendor's platform.
Practical Takeaways for Developers
For developers building Agent applications, this practice offers several ideas worth adopting:
- Instrument Early: Observability shouldn't be an afterthought — it should be considered from the architecture design phase.
- Embrace Open Standards: Prioritize universal specifications like OpenTelemetry to avoid vendor lock-in.
- Reuse Mature Tools: The Grafana ecosystem is powerful enough — there's no need to build a separate monitoring system for AI Agents.
Conclusion
Hermes Agent's integration with Grafana, though just a modest Show HN post on Hacker News, reflects a deeper need in AI Agent engineering. As more and more agents move into production, observability will no longer be optional — it will be foundational infrastructure for ensuring system stability.
With mature open-source platforms like Grafana, AI Agent runtime status can finally be observed, diagnosed, and optimized with the same clarity as traditional microservices. This small step may well be an important milestone in AI agents' journey from "flashy demos" to "reliable production systems."
Related articles

Chain of Thought Isn't Just for AI: How Humans Can Use CoT to Improve Thinking Quality
Chain of Thought isn't just a prompt trick for large models. Starting from a Hacker News discussion, this article analyzes why CoT works for human thinking too, breaks down actionable ways to transfer it, and highlights the key differences between human CoT and machine CoT.
Cloudflare Teams Up with OpenAI: Closi…
Cloudflare Teams Up with OpenAI: Closing the Loop from Vulnerability Discovery to Defense with AI
Cloudflare uses OpenAI Daybreak to investigate security vulnerabilities and generate reviewable remediation plans, while developers use Codex to boost coding efficiency and quality.

Orca Multi-Agent Orchestration in Practice: A Guide to Parallel Collaboration with Claude and Codex
Orca is Stable AI's free open-source agent workbench supporting 34 agents like Claude Code and Codex in parallel. Learn its Git worktree isolation, multi-model orchestration, and mobile management.