How Anthropic Used Claude to Make Claude.ai 3x Faster in Two Weeks

Anthropic used Claude itself to triple product performance in two weeks, but aggressive caching introduced data consistency bugs.
Anthropic tripled Claude.ai and desktop app performance in two weeks by having Claude measure before optimizing — using Valgrind instruction counts and React commit metrics as deterministic lab signals, with one-way CI ratchets to prevent regressions. Tech creator Theo praised the methodology but found aggressive caching caused stale sidebar data and lost threads — a classic side effect of metric-driven optimization targeting fewer network requests. The piece also touches on engineering culture: Anthropic, the first company to experiment with AI writing too much code at scale, is now using stronger models to clean up the resulting tech debt.
A recent post from Anthropic sparked intense discussion in the developer community: they tripled the performance of core user experiences in Claude.ai and the Claude desktop app within two weeks — and the one doing most of the heavy lifting was Claude itself. YouTube tech creator Theo (founder of the T3 ecosystem) did a deep breakdown of the article, praising its engineering methodology while also calling out the performance regressions it introduced.
The Real Performance Numbers
According to Anthropic, they focused on four core paths that account for 95% of user activity: launching the app, starting a conversation, loading an existing conversation, and sending a message. Measured at the 75th percentile, Claude.ai's initial load dropped from 3.1 seconds to 0.55 seconds, starting a new Claude Code session went from 0.8 seconds to 0.3 seconds, and loading a Claude co-work session fell from nearly 3 seconds to under 1 second.
More granular numbers are equally striking: sending a message in co-work dropped from 1 second to 48 milliseconds, and Claude Code on desktop went from 250 milliseconds to 52 milliseconds. Anthropic estimates these improvements save users tens of thousands of hours of waiting time every day.
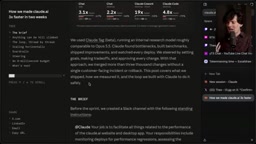
Theo, a longtime performance enthusiast, confirmed he genuinely noticed the difference. He had even picked up on Claude.ai loading noticeably faster on mobile hotspots earlier, and discovered they had migrated to frameworks like TanStack Router that handle navigation scenarios more efficiently.
Core Methodology: Measure First, Optimize Second
The most repeated takeaway from the entire optimization process was: "Once Claude could measure something, it could make it faster — so we kept finding more things to measure."
Anthropic first had Claude analyze usage data through the Datadog MCP server, identifying the four highest-impact user journeys and breaking them down into 13 individual measurement points. They established baseline instrumentation for each one, ensuring every measurement started from a user interaction and ended at result rendering, with a clear distinction between client-side and server-side work.
Theo strongly resonated with this. He recalled countless past workplace arguments about performance issues: someone's dashboard would show an operation took only 200 milliseconds, but that was only from component render to load completion — not from page load to fully interactive. "If it took 8 seconds to get there, your trace doesn't matter." Measuring the wrong thing is the most common trap in performance work.
How They Let Claude Validate Improvements in the Lab
To let Claude work asynchronously for hours or even overnight, Anthropic wasn't content to rely on real-world data from live deployments. Instead, they built deterministic metrics that could measure performance in a "lab" environment.
For pure JS hot paths, they used Valgrind with node --predictable to measure instruction counts — a single run could compare against the baseline with no statistical processing required. For browser paths, since instruction counting isn't possible under Chromium, they switched to a set of deterministic counters: React commit counts per interaction, function call counts via V8 precise coverage, layout and style recalculation counts, and DOM mutation counts.
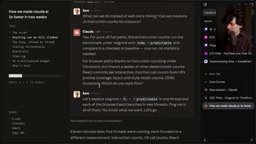
Crucially, they stayed skeptical of every new benchmark: each one had two jobs — serving as a metric Claude could optimize in the lab, and acting as a CI guardrail where numbers could only ratchet down. If a benchmark was noisy or uncorrelated with real user latency, it was discarded rather than letting Claude climb the wrong hill.
Theo found this deeply relatable. The most important change in his T3 Code data layer optimization wasn't the performance code itself — it was setting up a GitHub Action that tested data load sizes with real request formats to prevent regressions. This "slop test suite" might be thousands of lines long, and he admitted he never read it closely, but it consistently caught regressions before they shipped.
Valgrind is a classic Linux program analysis framework. Its core tool, Callgrind, simulates CPU execution and counts each instruction's invocations, producing deterministic measurements independent of actual clock time. node --predictable is a special V8 engine flag that disables randomized garbage collection scheduling and JIT compilation nondeterminism, making the same code produce nearly identical instruction sequences across runs. Together, they eliminate the need for "run 100 times and average" statistical approaches — a single run's instruction delta can directly tell you whether a code change is faster or slower. This is especially CI-friendly: no dedicated high-performance machines required, no sensitivity to system load fluctuations, and any ordinary runner can produce reproducible results. The tradeoff is that it only covers pure Node.js paths and can't simulate in-browser rendering behavior — which is exactly why Anthropic developed a separate suite of React commit counts and V8 coverage counters for browser scenarios.
The Hidden Cost: Over-Caching Causing Data Regressions
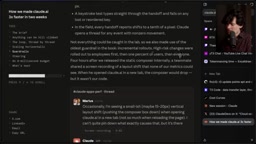
Theo live-tested Claude.ai during his stream and confirmed the performance improvements were real — but also uncovered serious data consistency issues. He deleted a conversation from the sidebar in one browser, then refreshed another browser, and the deleted conversation was still there. Clicking it threw an error but the sidebar would never revalidate. When submitting a new prompt, a thread could even "permanently disappear" if you refreshed before it persisted to the sidebar.
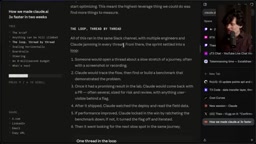
His diagnosis: Anthropic improved performance by "making things never update" — caching too aggressively with far too infrequent cache invalidation. He suspects that when Claude blindly targeted reducing React commits or V8 call counts, it was easy to disable network requests that weren't truly blocking interactivity — like not promptly syncing sidebar data from the network. This is the core risk of metric-driven optimization: V8 call counts can't see when a page becomes interactive, but they can see every request, so the agent tends to bluntly cut requests.
Theo's own approach differs: in T3 Chat, stale data during loading states is shown with a faded, blurred style, only clearing once real data arrives from the server — avoiding any appearance of confidence in inaccurate data.
The issue described here has a specific frontend engineering term: stale-while-revalidate (SWR) strategy abuse. SWR's intent is to immediately return cached stale data for faster rendering while simultaneously firing a background network request to refresh it, then replacing the UI once new data arrives. This strategy can significantly improve perceived speed — but only when paired with proper cache invalidation: whenever a user performs a write operation (delete, create, modify), the relevant cache entries must be immediately marked as dirty, otherwise stale data will be served as valid on the next read. Anthropic's regression is a textbook example of incomplete invalidation logic — after deleting a conversation, the sidebar list cache wasn't cleared, causing ghost entries to persist across tabs and refreshes. This is a Web-specific instance of the famous distributed systems problem: "cache invalidation is one of the hardest problems in computer science." When the optimization metric (reduce network request count) and the data correctness goal (timely state sync) aren't both included as guardrails, an agent's locally optimal solution can easily produce this kind of silent global failure.
The Engineering Culture Debate: Building Models ≠ Building Software
The article also sparked a discussion about engineering culture. Convex's Jamie commented: "Companies that are good at building models aren't necessarily good at software engineering." Theo extended this further.
He argued that Anthropic is actually the first company to experiment at scale with "what happens when you let AI write too much code." By heavily using models to generate code during the Sonnet 4 era, they accumulated a codebase full of slop — and are now using stronger models to go back and clean up the mess they created. Claude.ai, the desktop app, and Claude Code itself are all products of this dogfooding.
He also floated a bold hypothesis: the fundamental divide between OpenAI and Anthropic may not just be safety philosophy, but a difference in engineering versus research culture. OpenAI is engineer-led and holds researchers to engineering standards; Anthropic places relatively less emphasis on software engineers, which in turn affects their engineering hiring quality. "It's hard to automate what you don't understand, and hard to understand what you don't respect."
Engineering Practices Worth Borrowing
Controversy aside, Theo identified a wealth of learnable engineering wisdom in the article:
- Keep the composer mounted: Rather than unmounting the composer between sessions, they keep it alive and prefetch conversations on hover — reducing re-renders by 90% and making navigation feel absurdly fast.
- Horizontal scaling: Once the end-to-end workflow is running, you can spin up large numbers of parallel threads across multiple machines and instances. Theo's own agent once auto-merged 40 performance optimization PRs, with 38 showing real gains.
- Prompt boldly: Anthropic's engineers used phrases like "be ambitious," "boil the ocean," and "I'm open to crazy ideas" to motivate the model. Theo explains these words pull the model away from the safe "happy path" toward more aggressive but often more effective approaches — provided you have enough guardrails as a safety net.
- Handling non-Latin characters: Claude discovered that a single curly quote or em dash in Markdown causes V8 to store the entire string as UTF-16, pushing syntax highlighting regexes onto the slower two-byte path. A 20-line fix — converting code blocks to single-byte strings before highlighting — solved the problem.
Theo also offered his own recommendation: move syntax highlighting into a Web Worker and run it with Wasm, completely unblocking the main thread.
The V8 string storage issue mentioned here involves a low-level engine detail: V8 has two internal string representations. If all characters fall within Latin-1 range (ISO 8859-1, code points 0–255), it stores them as a one-byte string at 1 byte per character. The moment any character falls outside this range — curly quotes ', em dashes —, or any CJK character — the entire string is upgraded to a two-byte (UTF-16) string at 2 bytes per character. The regex engine has separate execution paths for these two encodings, and the two-byte path can be several times slower in dense matching scenarios. For syntax highlighting, which repeatedly runs many regexes over code blocks, this difference is multiplied significantly. Anthropic's fix — converting code blocks to single-byte strings before highlighting — is a "downgrade encoding" technique that sacrifices the string's original representation in exchange for regex execution on the fast one-byte path. These kinds of hidden performance traps rarely appear in JavaScript specs or common performance tutorials; identifying them requires deep knowledge of engine internals. This also underscores the value of the "let the model find measurable metrics first" methodology — without instruction counting as a measuring stick, this problem would be nearly impossible to locate at the source code level.
Engineering Capabilities for a New Era
Theo closed with a point that's controversial but one he firmly believes: reading code is no longer the key to solving these kinds of problems. Without access to Anthropic's repository, armed only with a blog post and Claude's responses, he was able to intuit the likely root cause of the sidebar regression. That intuition comes from nearly a decade of hands-on performance optimization.
"If you still think reading all the code is how you solve these problems, you're going to run into a whole other set of problems. Learning to work with slop, and around slop, is becoming the new meta." This is a kind of engineering that requires a new kind of craft — building the systems and structures that let agents operate effectively.
The biggest lesson from this article: if you just tell a model to "improve performance," it will do its best based on its own theories. But if you tell it to "first find ways to measure performance, validate those findings, and then optimize" — the results are dramatically better.
Related articles

@ai-sdk/vue 3.0.306 Patch Release Syncs with [email protected] Update
@ai-sdk/vue 3.0.306 released, synced with [email protected]. A routine patch release for the Vercel AI SDK ecosystem with no public API changes; the Vue adapter layer stays version-aligned with the core package.

Gemini 4 Argon API Launches: The Era of Million-Token Output Begins
Google launches Gemini 4 Argon with sparse MoE architecture, up to 1M output tokens, and a 68.90% Vals Index score, available across API, AI Studio, and the Gemini app.

DukaanAI: Turning Product Photos into Inventory Lists with Open-Source AI
DukaanAI is an AI inventory tool for small retailers that turns product photos into inventory entries using the open-source Gemma 3 model, with local inference, editable fields, and CSV export.