How to Draw CNN Neural Network Architecture Diagrams? A Complete Guide to Tools and Methods

A complete guide to tools and methods for drawing professional CNN neural network architecture diagrams.
This article systematically reviews mainstream tools and methods for visualizing CNN architectures, including NN-SVG, PlotNeuralNet, Netron, torchviz, and Keras plot_model. It covers use cases from academic papers to GitHub project documentation, offering practical guidance on choosing the right tool based on your specific needs.
Introduction: The Value of an Architecture Diagram
In deep learning projects, model architecture diagrams are essential tools for communication, teaching, and paper writing. Whether in a GitHub README or as a figure in an academic paper, those layered, color-coded convolutional neural network (CNN) diagrams can help readers grasp the overall structure of a complex model within seconds.
Convolutional Neural Networks are among the most classic architectures in deep learning, with their foundation laid by Yann LeCun's LeNet-5 model proposed in 1998 for handwritten digit recognition. The core idea of CNNs is to automatically extract local features from input data through Convolutional Layers, leveraging parameter sharing and local connectivity to dramatically reduce the number of model parameters. A typical CNN architecture includes convolutional layers, Pooling Layers, Fully Connected Layers, and other components, with data flowing through these layers sequentially—from low-level features (such as edges and textures) to progressively more abstract high-level semantic features (such as object parts and categories). It is precisely this hierarchical structural characteristic that makes CNN architecture visualization particularly intuitive—each layer can be represented as a tensor block with clear geometric dimensions, and the connections between layers are easy to trace.
Recently, a Reddit user posted a highly representative question in the community: "I've seen many beautiful neural network architecture diagrams in GitHub READMEs and online, but I don't know how to make them. Are there any websites or tools for drawing such diagrams?"
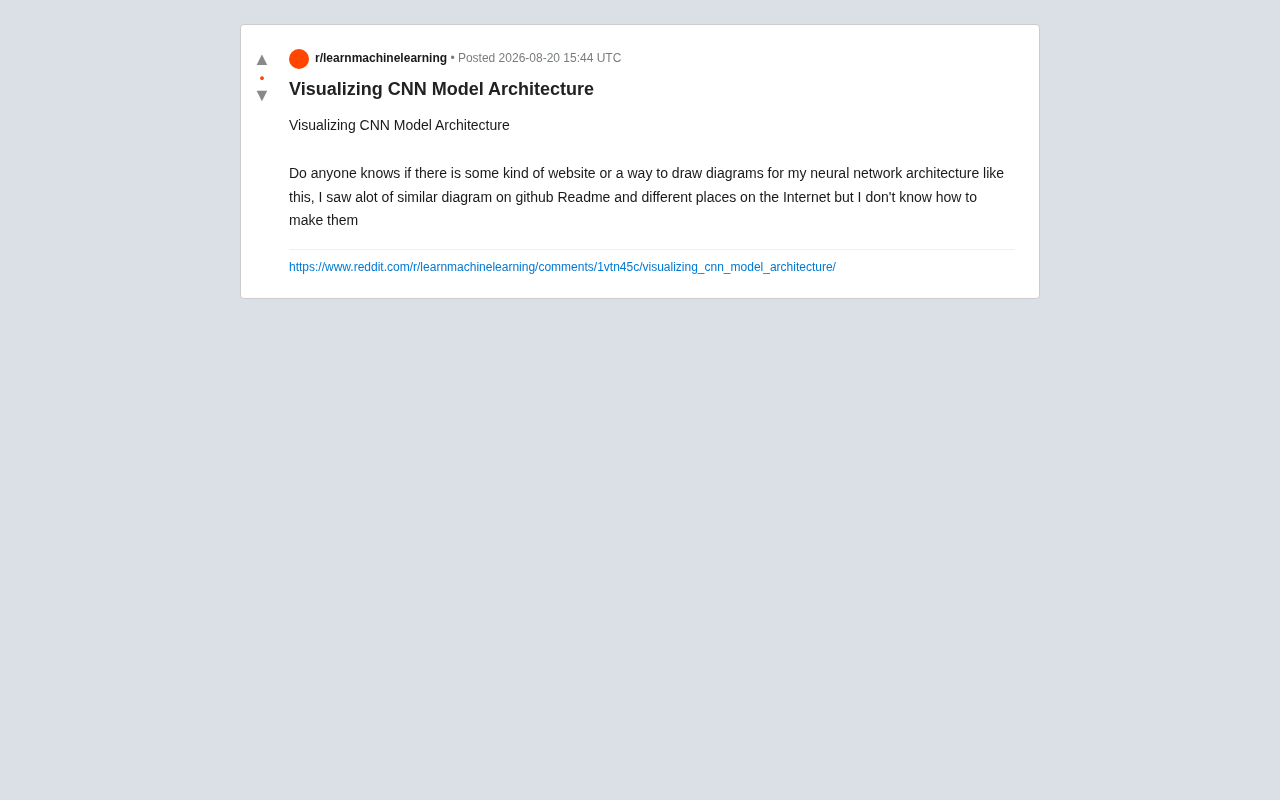
Behind this question lies a common challenge shared by many deep learning beginners and practitioners: how to transform abstract model code into intuitive, professional visualizations. This article provides a systematic overview of the mainstream CNN architecture visualization methods and tools available today, helping you choose the most suitable solution for different scenarios.
Why Visualize CNN Model Architectures
Improving Communication and Collaboration Efficiency
When you need to explain your model design to team members, advisors, or reviewers, pure code or text descriptions are often inefficient. A clear CNN architecture diagram can directly show the connections between layers, changes in tensor dimensions, and data flow direction, significantly reducing the cognitive burden.
Assisting Model Debugging and Verification
Visualization can also help you spot issues in model design. For example, whether a layer's output dimensions match expectations, whether skip connections are correctly integrated, or whether channel number changes are reasonable—these are often immediately apparent in a diagram but easily overlooked in code.
Skip connections are a key design element in deep neural networks, first introduced by Kaiming He et al. in ResNet (Residual Network) proposed in 2015. The core idea is to take the input of a certain layer and "skip" over several intermediate layers, adding or concatenating it directly with the output of a deeper layer. This design addresses the vanishing gradient problem in deep network training—when the number of layers increases to dozens or even hundreds, the gradient signal during backpropagation attenuates layer by layer, making it nearly impossible to update parameters in shallow layers. Skip connections provide a "highway" for direct gradient flow, making it possible to train extremely deep networks. In architecture visualizations, skip connections are typically represented as arcs or arrows from an earlier layer bypassing intermediate layers to connect directly to a later layer. If visualization tools fail to correctly display these connections, it can lead to misinterpretation of the model structure.
Meeting Paper and Documentation Requirements
In academic papers and technical documentation, architecture diagrams are practically mandatory. A professional neural network diagram not only improves content readability but also directly influences the reader's first impression of the work's quality.
Overview of Mainstream CNN Architecture Visualization Tools
For the need to create "those beautiful CNN architecture diagrams," the field already offers several mature solutions, which can be roughly categorized into three types.
Dedicated Neural Network Drawing Tools
NN-SVG is a widely popular online tool specifically designed for generating neural network diagrams. It supports FCNN (fully connected networks), LeNet-style, and AlexNet-style 3D convolutional layer visualizations, outputting in vector SVG format—perfect for papers. Many of those classic illustrations with 3D block-style convolutional layers seen in GitHub READMEs come from tools like this.
SVG (Scalable Vector Graphics) is an XML-based two-dimensional vector graphics format standardized by the W3C. Unlike raster formats such as PNG and JPEG, SVG describes graphic elements (points, lines, curves, polygons, etc.) using mathematical formulas, so images remain crisp regardless of how much they are scaled up—no pixelation or blurring. This property is particularly important in academic publishing—journals and conferences typically require figures to remain clear at 300 DPI or higher resolution, and vector formats inherently meet this requirement. Additionally, SVG files can be directly modified with a text editor and further edited in professional design software like Adobe Illustrator or Inkscape, making it convenient for researchers to fine-tune and refine auto-generated diagrams.
PlotNeuralNet is a LaTeX-based open-source project capable of generating publication-quality architecture diagrams. It requires writing some descriptive code, but in return offers extremely high customization freedom and beautiful output, making it a favorite among academic researchers.
LaTeX is a document preparation system based on the TeX typesetting engine, developed by Leslie Lamport in 1984, and remains the de facto standard for academic paper writing in computer science, mathematics, physics, and related fields. Unlike WYSIWYG editors such as Word, LaTeX uses a markup language to describe document structure and formatting, offering unparalleled support for equation typesetting, bibliography management, and cross-referencing—essential needs in academic writing. PlotNeuralNet's choice to build on LaTeX (specifically using the TikZ drawing package) means its output can be seamlessly embedded in LaTeX papers, maintaining consistency in fonts, lines, and overall style. TikZ itself is an extremely powerful programmatic drawing tool supporting precise coordinate control, rich style definitions, and complex graphic transformations—this is the technical foundation that enables PlotNeuralNet to achieve publication-level diagram quality.
Code-Based Auto-Generation Visualization Tools
For users who want to generate diagrams directly from model code, the following tools are more convenient:
- Netron: A cross-platform model visualization powerhouse that supports ONNX, TensorFlow, PyTorch, Keras, and virtually all mainstream formats. Simply drag in a model file and it automatically generates an interactive hierarchical structure diagram—ideal for quickly inspecting existing model architectures.
ONNX (Open Neural Network Exchange) is an open deep learning model representation format jointly initiated by Microsoft and Facebook in 2017. ONNX was created to solve the model interoperability problem between deep learning frameworks—before ONNX, models trained in PyTorch couldn't run directly in TensorFlow and vice versa, requiring extensive manual conversion work for model migration. ONNX defines a universal set of operators and a model structure description specification, enabling models to be freely converted and deployed across different frameworks and inference engines (such as TensorRT, OpenVINO, and ONNX Runtime). Netron's ability to support model files from virtually all mainstream frameworks is largely thanks to ONNX's role as a bridge in the form of an intermediate representation format.
- torchviz / torchview: Designed for PyTorch users, these tools can automatically draw model structures based on the computational graph, intuitively showing tensor flow during forward propagation.
The Computational Graph is a core abstraction in modern deep learning frameworks. It represents a model's mathematical operations as a Directed Acyclic Graph (DAG), where nodes represent operations (such as matrix multiplication, convolution, activation functions, etc.) and edges represent the flow direction of data (tensors). PyTorch uses dynamic computational graphs (Define-by-Run), meaning the graph is dynamically constructed during each forward pass—this provides great programming flexibility but also means the model structure can only be determined during actual execution. Tools like torchviz and torchview leverage this mechanism by recording the computational graph construction process during forward propagation, then converting it into a visual diagram. Understanding the concept of computational graphs helps distinguish the subtle difference between "model architecture diagrams" and "computational graph visualizations"—the former focuses on high-level module organization, while the latter shows every low-level operation.
- Keras plot_model: TensorFlow/Keras's built-in
tf.keras.utils.plot_modelfunction can export a model structure diagram with a single line of code—perfect for quick prototype verification.
General-Purpose Drawing Software
For those seeking complete visual control, draw.io (now diagrams.net) and Microsoft PowerPoint remain popular choices. While they require manual drawing, they offer maximum flexibility—allowing precise control over every color block, arrow, and annotation style. In fact, many uniquely styled architecture diagrams in papers are carefully hand-drawn using these general-purpose tools.
How to Choose the Right CNN Visualization Tool
With so many options available, the key to choosing lies in clarifying your core needs:
For quickly viewing model structure—Netron is the top choice: zero configuration, broad format support, and strong interactivity.
For academic paper publication—PlotNeuralNet or NN-SVG are recommended. The former offers strong customization and beautiful output; the latter is simple to use and works out of the box.
For highly customized visual styles—draw.io or PowerPoint hand-drawing provides the most flexible approach, though it requires more time.
For quick debugging within a training framework—framework-built-in tools (such as Keras's plot_model or torchview) are sufficient.
Practical Tips for Drawing CNN Architecture Diagrams
For users who want to get started quickly, the recommended path is: first use Netron to load your model file and quickly obtain an auto-generated structure diagram as a reference; if you need something for formal publication or external presentation, then use NN-SVG or PlotNeuralNet to create a more polished version.
One important detail: a good architecture diagram isn't about how flashy the colors are—it's about accuracy and clarity of information delivery. When drawing, annotate key information: the type of each layer, output dimensions, kernel sizes, and activation functions, so readers can truly understand your design intent.
Conclusion
Model visualization is not a core technical challenge in deep learning, but it is an indispensable part of engineering practice and academic expression. From the automated Netron, to the professional PlotNeuralNet, to the flexible draw.io, there is a rich variety of CNN architecture diagram tools to choose from. Mastering these tools not only makes your project documentation more professional but also helps you achieve more with less effort in team collaboration and paper writing. For any deep learning practitioner, this is a practical skill well worth investing time to learn.
Related articles

DeepCell: One-Click AI Generation of Documents, Spreadsheets, and Slides
DeepCell tops Product Hunt with one-click generation of documents, spreadsheets, and slides, using the .deepcell format for linked updates, designed for System 2 tasks like modeling and sales reviews.

Doneas: 15-Minute Daily Accountability Calls That Keep Indie Developers From Procrastinating
Doneas is a daily accountability tool for indie developers: plan tasks on Monday, join a 15-minute call with five builders each day, and log deliveries on a public progress page. This article analyzes its core mechanics, effectiveness, and potential issues around retention and matching.

Fastlane 2.0: Fully Automated AI Ad Campaigns, From Creative to Optimization
Fastlane 2.0 is an AI ad automation tool: enter your website and it learns your brand, generates video and image ads, and runs and optimizes them on Meta, TikTok, Instagram, and YouTube.