Integrating AI MCP Service into x64dbg: Using Large Language Models to Assist Reverse Engineering

Integrate an MCP plugin into x64dbg to let AI models directly control the debugger for semi-automated reverse engineering.
This article explains how to integrate the MCP (Model Context Protocol) plugin into the open-source debugger x64dbg, enabling large language models to read assembly, registers, and stack data — and execute operations like setting breakpoints, reading/writing memory, and signature scanning. Setup is simple: drop the plugin into x64dbg's directory, start the local service, and configure a matching port in the AI client. Tests confirm the AI can return attached process information and set breakpoints successfully, potentially lowering the barrier to manual assembly analysis. The author also cautions that AI-driven targeting can be inaccurate and still requires human review, and that using this technology for game cracking or similar purposes carries legal risks.
What Is the x64dbg MCP Plugin?
x64dbg is a widely used open-source debugger in the reverse engineering field, while MCP (Model Context Protocol) serves as the bridge that enables AI models to interact with external tools. Combining the two means a large language model can directly read assembly code, registers, and stack information from the debugger — and issue commands such as setting breakpoints, reading/writing memory, and scanning for byte signatures — enabling semi-automated reverse analysis.
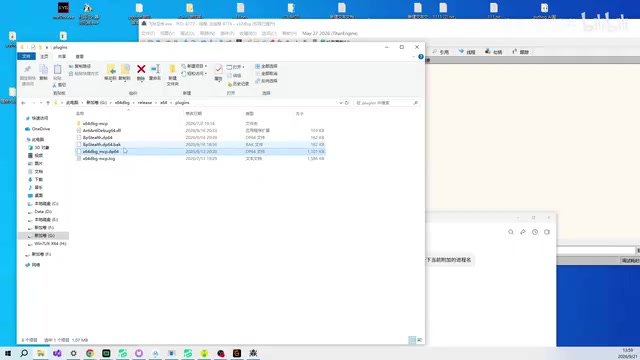
As demonstrated by a Bilibili content creator, the integration process is straightforward and revolves around a single MCP plugin. The plugin comes in both 64-bit and 32-bit variants, which can be used simultaneously — simply place the appropriate plugin file into x64dbg's plugin directory. The demo also mentions a "breakpoint hiding" helper plugin, but that's unrelated to the MCP service and can be ignored.
MCP (Model Context Protocol) is an open protocol proposed by Anthropic in late 2024, designed to provide large language models with a standardized "tool-calling" interface. The core idea is that the AI model itself handles only reasoning and decision-making, while actual operations on external systems (reading files, executing commands, calling APIs, etc.) are handled by an MCP Server. The client (such as Claude Desktop or Cursor) acts as the relay between model output and the MCP Server. In the x64dbg context, the debugger plugin acts as the MCP Server and the AI client acts as the Host — the model triggers specific debugger instructions based on natural language intent, without requiring developers to manually write debug scripts. This is the key difference from traditional x64dbg scripting (e.g., xdbg Script or Python extensions): MCP allows the model to dynamically choose which tool to call and with what parameters based on context, rather than following a fixed, pre-written workflow.
Plugin Deployment and Service Activation
Deployment is straightforward: place the MCP plugin into the x64dbg directory, then restart or reload the debugger. A new option to enable the MCP service will appear in the interface. Once activated, the debugger begins listening on a local service port, waiting for an AI client to connect.
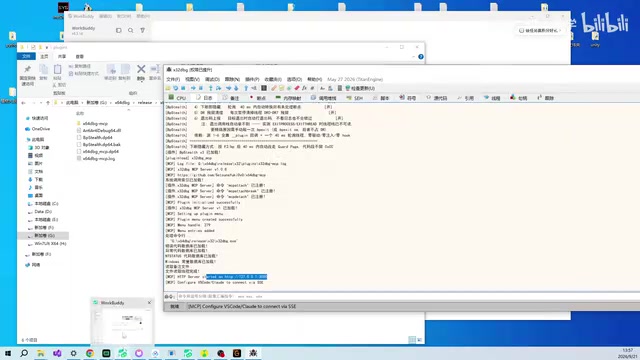
With the service running, you need to configure the connection on the AI client side. The demo uses a "custom connector" — navigate to the "Configure MCP" screen and paste in the few lines of configuration code provided by the plugin. The critical detail here is that the port number must match: if the debugger service is listening on port 3000, the client configuration must also specify 3000. A mismatched port will cause the connection to fail.
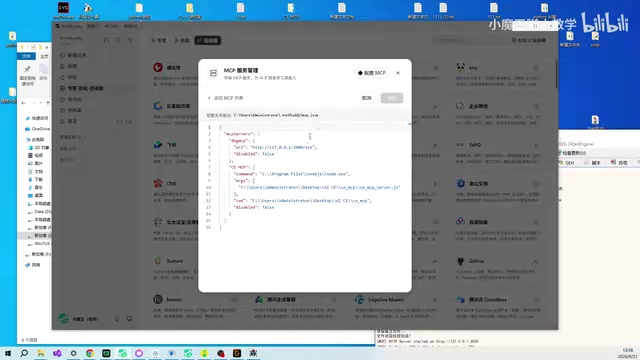
Verifying the Connection and Available Commands
Once the configuration is in place and the connection toggle is switched on, the status indicator turning green confirms a successful connection. At this point, attach x64dbg to a target process (the demo uses a game process as a test) and verify via conversation whether the AI is truly connected to the debugger.
Asking the AI to "check the name of the currently attached process" yields the correct process information, confirming the MCP channel is working. Following up by asking what operations it can perform, the AI lists a range of debugger capabilities:
- Debugger control: start or attach to a process
- Step execution, set and manage breakpoints
- Memory read and write
- Byte signature (pattern) scanning
- Allocation and deallocation of remote memory
- Retrieve runtime state such as registers and stack
These capabilities cover the most common operations in reverse analysis, which is precisely where MCP has an edge over traditional scripting — the AI can autonomously invoke these tools based on natural language intent.
In Practice: Having AI Set Breakpoints and Analyze Assembly
The final part of the demo involves instructing the AI to set a breakpoint at a specified address. After receiving the command, the model responds that "a breakpoint has been set at that location" — jumping to the address confirms the line is highlighted in red, and the log records the breakpoint as successfully configured.
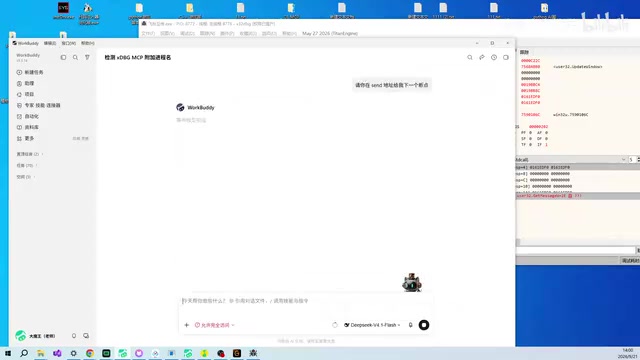
Once breakpoint functionality is verified, the more practical use case is having the AI automatically analyze assembly code. For unfamiliar instructions or complex branching logic, you can directly ask the model to read the code, stack, and register state and provide an explanation. The creator also notes that this workflow could theoretically be applied to automated license verification (registration/authorization) analysis and game debugging, significantly lowering the barrier to reading assembly manually.
Pattern/Signature Scanning is a common reverse engineering technique for locating target functions or code fragments. Since a function's absolute address may change between compilations, reverse engineers typically extract a distinctive byte sequence from the target code (e.g.,
48 8B 05 ?? ?? ?? ??, where??serves as a wildcard) and search for matching locations in process memory. This allows stable targeting even under address space layout randomization (ASLR) or after version updates. Exposing signature scanning to an AI means the model could theoretically complete an entire analysis chain autonomously — from "locate a function entry point via a known signature → set a breakpoint → trigger it and read register state" — without requiring manual step-by-step interaction with the debugger.
Value and Limitations
The greatest significance of integrating MCP into x64dbg is closing the loop between "AI understanding code" and "debugger executing operations." Previously, reverse engineers had to manually read assembly, set breakpoints, and observe registers. Now, parts of this workflow can be delegated to the model, making it especially useful for analyzing unfamiliar instructions and quickly locating critical logic.
However, some clear-eyed caveats are in order: the material in this article comes from a single-source demo, and the accuracy of AI-driven breakpoint placement — as well as its ability to handle heavily packed or anti-debug programs — has not been thoroughly validated. The demo itself showed instances of misidentification ("why are there so many breakpoints?" and "this probably isn't the right place"), indicating that AI-assisted debugging still requires human review. Additionally, applying this technology to scenarios such as game cracking carries legal and compliance risks — readers should use it exclusively for legitimate security research and educational purposes.
Related articles

EduRAG Intelligent Q&A System: A Hands-On Breakdown of a Heima AI Agent Project
A breakdown of the Heima EduRAG Intelligent Q&A System course, covering LangChain, Milvus vector database, hybrid search, and reranking to solve factual hallucinations in the IT domain, with job market insights and a learning path.

Mia Goth Blasts Instagram for Letting AI Fake Run Rampant: Even Verified Accounts Can't Escape AI Forgery
Mia Goth found an AI-generated fake image spreading through an Instagram blue-check verified account and publicly questioned why the platform failed to intercept it. The incident exposes structural flaws in social platform verification systems when facing AI-forged content.

Apple HomeView Hands-On: Apple's Answer to the Smart Home Hub
Apple HomeView hands-on: 7-inch square touchscreen, built-in Siri AI, positioned as a three-in-one smart home controller and hub. We analyze its hardware design, Siri control logic, and differentiation in the smart display market.