IntentLens: A Local Data Analysis Tool That Makes You Confirm Metric Definitions Before Generating Charts

IntentLens forces you to confirm metric definitions before chart generation to prevent mathematically-correct-but-wrong-question visualizations.
IntentLens addresses an overlooked trap in data analysis: charts can be mathematically correct yet answer entirely different questions depending on aggregation method — the classic gap between overall and grouped average conversion rates. This locally-run Excel/CSV workbench exposes grouping logic, aggregation rules, ratio definitions, and missing-value handling for user review before any chart is generated. The AI proposes declarative analysis plans rather than executing arbitrary code, balancing controllability and safety. A no-install demo is available online; the full version supports user files and LLM interaction and is open-sourced on GitHub, though model-assisted planning sends field metadata to the configured provider.
Why a Chart Can Answer the Wrong Question
A chart can look perfectly correct while answering the wrong question entirely. This is the core observation that led to IntentLens — and the starting point for the whole project.
The developer illustrates the trap with a simple example. Given two groups of data:
- Group A: 100 visits, 10 conversions → 10% conversion rate
- Group B: 10 visits, 5 conversions → 50% conversion rate
The overall conversion rate is 15 / 110 ≈ 13.64%, but the average of the two group rates is 30%. Both calculations are mathematically valid — yet they answer completely different questions.
The problem is that most analysis tools bury this choice behind the chart. By the time the visualization appears, users have already implicitly accepted some aggregation logic, with no opportunity to confirm whether it actually matches what they intended to ask. IntentLens aims to surface that choice explicitly, before the chart is ever generated.
This phenomenon is closely related to Simpson's Paradox in statistics — where a trend that appears in aggregate data disappears or even reverses when the data is broken into subgroups. The classic example comes from 1973 UC Berkeley admissions data: the overall numbers appeared to show bias against female applicants, but when broken down by department, most departments actually admitted women at higher rates — the disparity arose because women disproportionately applied to more competitive departments. The conversion rate example falls into the same trap: depending on how you weight the groups, conclusions can be diametrically opposed. This is why "choosing an aggregation method" isn't a technical detail — it's part of the analytical intent itself. Different aggregation logic answers different business questions, and mixing them up can produce results that look reasonable but are meaningless in context.
What IntentLens Is Building
IntentLens is a locally-run Excel/CSV visualization workbench with an explicitly structured workflow:
Import data → Describe the question → Review the plan → Compute → Refine → Export
The most critical step is reviewing the plan. Before any computation happens, users can inspect the grouping strategy, aggregation logic, ratio definitions, and missing-value handling. The full application also supports chart revisions and reproducible exports.
From a technical design perspective, IntentLens makes a notable tradeoff: the model does not directly generate arbitrary Python or JavaScript code to execute. Instead, it proposes declarative analysis plans. The application validates these plans before performing calculations against a data snapshot. This avoids the unpredictability and security risks of "letting an LLM run arbitrary code," and ensures every computation step can be reviewed by a human.
Why Declarative Plans Are Safer
Having AI execute code directly is common in data analysis tools, but the risks are real — generated code may have side effects, be hard to reproduce, and difficult to evaluate for correctness before it runs. IntentLens takes a "plan first, validate, then compute" approach, limiting the AI's role to proposing analytical logic rather than directly manipulating data. This aligns with the broader emphasis on controllability emerging across recent AI tooling.
Declarative and imperative are two fundamentally different programming paradigms. Imperative code describes how to do something — like a Python script that manipulates a DataFrame step by step. Declarative code describes what is wanted — for example, "group by month, sum conversion events, divide by visit count to get conversion rate." In AI code-generation scenarios, the risk with imperative scripts is that the model may introduce file I/O, network requests, or unintended data mutations — and the cost of manually reviewing a script is far higher than reviewing a structured description of analytical intent. Declarative plans constrain the AI's output to an enumerable set of operation types (grouping, aggregation, filtering, etc.), which the application layer can whitelist-validate. This fundamentally isolates side-effect risks from code execution and makes every logical step explainable to users in plain language.
A No-Install Online Demo
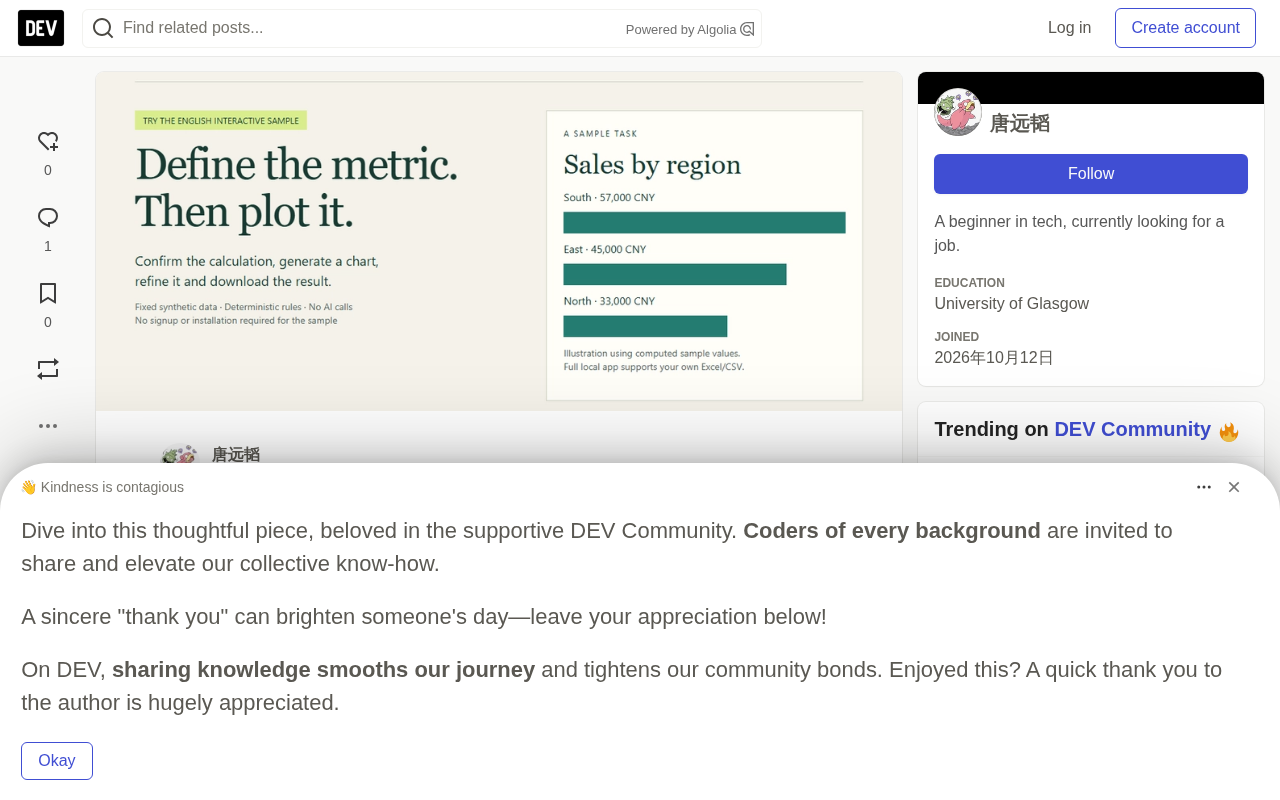
The developer provides an interactive English demo that requires no installation, registration, or API key — accessible directly in the browser.
A suggested exercise to try:
- Select a conversion-rate-related question
- Compare "overall conversion rate" vs. "monthly average conversion rate"
- Generate the chart
- Modify the chart title or sort order
- Download the result
One important caveat: the public demo uses fixed synthetic data and deterministic rules — it does not call any AI and does not accept file uploads. The two-group example at the beginning of this article is purely conceptual and separate from the actual 12-record dataset used in the demo.
This design lets users understand the value of the "confirm metric definitions" step at zero cost and zero risk, before deciding whether to deploy the full version.
Full Local Version Capabilities
The complete workbench supports processing users' own Excel/CSV files, conversational interaction with configured LLMs, multiple charting engines, and revision history.
The developer also recorded an English walkthrough demonstrating the real local workflow: uploading a synthetic CSV file, entering a question, receiving an analysis plan from DeepSeekAd, generating a chart, and verifying the computed regional totals against the original input data.
The author is transparent about current limitations: this is still a development version intended for trusted, single-user local environments. Model-assisted plan generation requires an API key and sends field metadata and statistical summaries to the configured provider. In other words, the privacy boundary is something users need to assess for themselves — local computation handles the data itself, but field structure and statistical summaries do leave the local environment. The source code and installation instructions are open-sourced on GitHub.
The Feedback the Author Is Seeking
What makes this project particularly interesting is that the developer remains genuinely open about whether the confirmation step is actually worth it. He explicitly wants to validate whether, in real reporting workflows, this review step prevents errors — or just adds friction.
For users who regularly work with spreadsheets, he raises several concrete questions:
- In your last report, would reviewing metric definitions have prevented a mistake, or would it have just slowed you down?
- Where did you get stuck in the demo?
- What would you use instead, and what does that workflow do better?
The author is also looking to recruit five users with recurring reporting tasks to try the full application with public or anonymized data.
For users accustomed to "AI-generated charts in one click," IntentLens represents the opposite philosophy: slow down, define the question clearly first, then let the machine compute. At a time when AI is getting better and better at "delivering fast answers," a tool that emphasizes "aligning on the question first" may be hitting exactly the pain point most often overlooked in data analysis.
Related articles

Chain of Thought Isn't Just for AI: How Humans Can Use CoT to Improve Thinking Quality
Chain of Thought isn't just a prompt trick for large models. Starting from a Hacker News discussion, this article analyzes why CoT works for human thinking too, breaks down actionable ways to transfer it, and highlights the key differences between human CoT and machine CoT.
Cloudflare Teams Up with OpenAI: Closi…
Cloudflare Teams Up with OpenAI: Closing the Loop from Vulnerability Discovery to Defense with AI
Cloudflare uses OpenAI Daybreak to investigate security vulnerabilities and generate reviewable remediation plans, while developers use Codex to boost coding efficiency and quality.

Orca Multi-Agent Orchestration in Practice: A Guide to Parallel Collaboration with Claude and Codex
Orca is Stable AI's free open-source agent workbench supporting 34 agents like Claude Code and Codex in parallel. Learn its Git worktree isolation, multi-model orchestration, and mobile management.