METR Time Horizon Estimates Face Statistical Scrutiny: AI Capability Evaluation Needs Reexamination

METR time horizon's linear assumption fails; AI difficulty is nearly flat from 2-30 minutes, so cross-range comparisons need caution.
A new study reanalyzed the statistical model behind METR time horizon metrics, finding that the core assumption—a linear relationship between AI difficulty and log human completion time—does not hold. Using spline functions and Item Response Theory on 228 tasks and 26 AI models, researchers found the fitted curve is nearly flat from 2 to 30 minutes, meaning a 10x jump from 3 to 30 minutes adds far less AI difficulty than an equivalent jump from 30 minutes to 5 hours. New estimates perform better under cross-validated scoring rules, and diagnostic charts are provided to assess construct validity. The study advises including diagnostic information when reporting time horizon and exercising caution in cross-range comparisons, as nonlinearity's impact will grow as benchmarks extend to longer time spans.
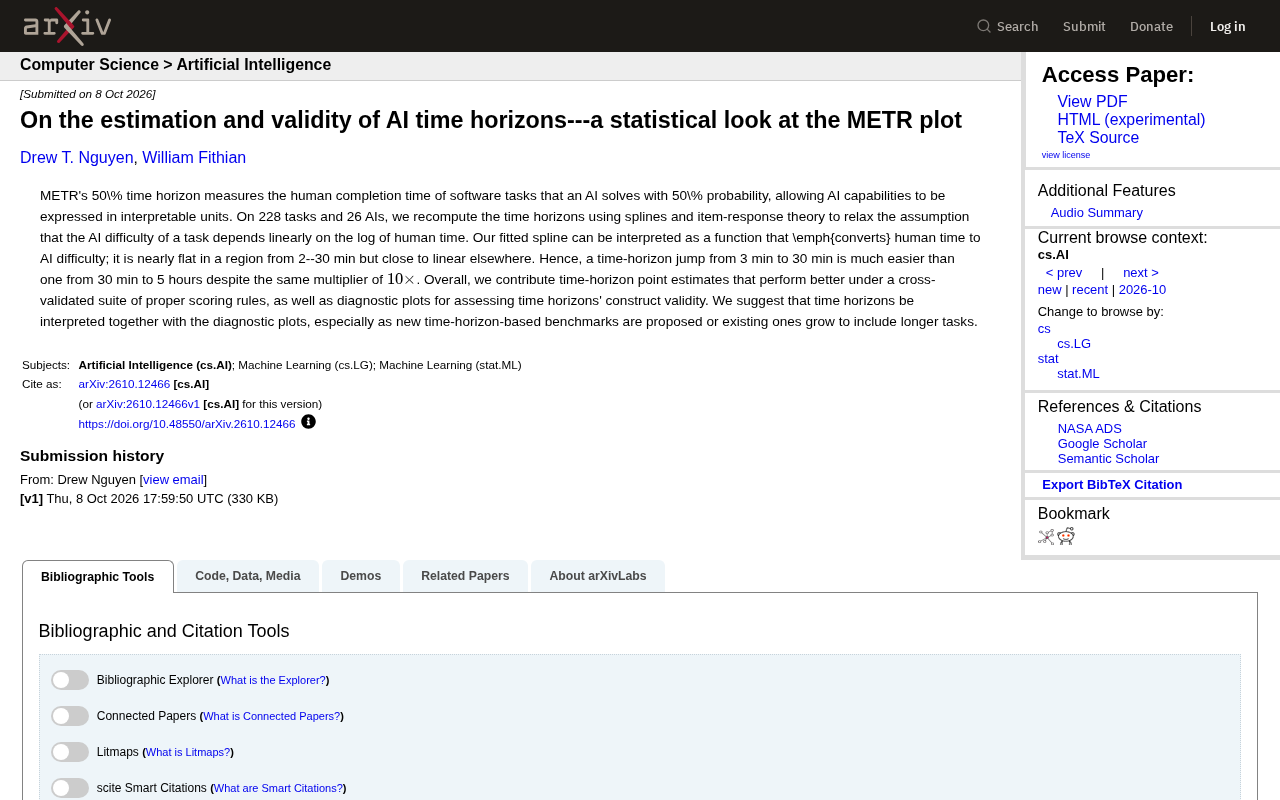
METR's "50% time horizon" metric has become an important yardstick for measuring AI coding capabilities—it expresses AI's capability boundary in terms of how long it takes humans to complete software tasks. But is the statistical foundation of this widely cited metric solid? A new study reanalyzed data from 228 tasks and 26 AI models, revealing a previously overlooked problem: the relationship between task difficulty and human completion time is not a simple linear one.
The Core Logic and Implicit Assumptions of the Time Horizon Metric
METR's time horizon is defined as: the time it takes a human to complete software tasks that an AI can successfully complete with 50% probability. The cleverness of this design lies in mapping AI capability onto the intuitively understandable unit of "human working time," allowing even non-technical audiences to perceive a model's capability level.
However, the statistical model behind this metric contains a key assumption: that AI difficulty of a task has a linear relationship with the logarithm of human completion time. The research team points out that this assumption does not hold in actual data. They used spline functions and Item Response Theory to recalculate the original data, finding that the fitted spline function exhibits clear nonlinear characteristics.
This spline function can be understood as a "human time to AI difficulty" transformation function. It is nearly flat in the roughly 2-to-30-minute range, and approaches linearity in other ranges. This means that the same 10x increase in time horizon corresponds to vastly different magnitudes of AI capability improvement depending on the range.
Item Response Theory (IRT) is a statistical framework for analyzing test or assessment data, originally applied in psychometrics and educational testing. Its core idea is that a test-taker's (here, an AI model's) performance on a given item (here, a software task) is jointly determined by the model's latent ability level and the item's characteristic parameters. Classical IRT models (such as the Rasch model or the two-parameter logistic model) can simultaneously estimate each model's "ability value" and each task's "difficulty value" and "discrimination," thereby placing model ability and task difficulty on the same scale for comparison. The advantage of introducing IRT into AI evaluation is that it does not rely on simple pass-rate averages, but instead uses probabilistic models to more precisely characterize the interaction between models and tasks—particularly suited for handling missing data problems that arise when different models complete different subsets of tasks. It is precisely with the IRT framework that the research team transformed METR's original pass-rate data into more robust difficulty estimates.
Spline Function is a flexible functional form constructed by piecing together piecewise polynomials, with certain smoothness constraints satisfied at the junction points (called "knots"). Unlike global linear regression or high-degree polynomials, spline functions allow the function to exhibit different curvature in different ranges, making them particularly suitable for fitting complex relationships that are flat in some ranges and steep in others. In the context of this paper, spline functions are used to model the mapping from "logarithm of human completion time" to "AI difficulty." Since researchers do not know the specific shape of this mapping in advance, using splines rather than imposing a linear assumption avoids model specification bias and lets the data "speak for itself." It is precisely this flexibility that allowed the researchers to discover the flat segment in the 2-to-30-minute range—a key structure that would be masked if a linear model were forced. Commonly used spline types include natural cubic splines and B-splines, the latter being more computationally stable.
What Nonlinearity Means: 3 Minutes to 30 Minutes Is Far Easier Than 30 Minutes to 5 Hours
The most striking finding of this study is that multiplicative increases in time horizon are not equivalent.
Specifically, the jump from 3 minutes to 30 minutes (10x) corresponds to a far smaller increment in AI difficulty than the jump from 30 minutes to 5 hours (also 10x). The reason is that in the 2-to-30-minute range, increases in human completion time barely change the task's AI difficulty—tasks in this range are of similar difficulty for AI. Beyond 30 minutes, however, each unit increase in human time makes AI difficulty rise more steeply.
The practical implications of this finding for AI capability evaluation are not to be underestimated. If one merely compares multiplicative changes in time horizon, one may overestimate capability progress in the short-task range or underestimate the difficulty of capability improvement in the long-task range. The research team emphasizes that point estimates of time horizon should be evaluated under cross-validated scoring rules, and their new estimates perform better across multiple proper scoring rules.
Construct Validity: What Is Time Horizon Actually Measuring?
Beyond the estimation method itself, the study also addresses a deeper question: the construct validity of time horizon.
In other words, does this metric really measure what it claims to measure? The research team provides diagnostic charts to help assess the construct validity of time horizon, and recommends interpreting time horizon in conjunction with these diagnostic charts. The urgency of this recommendation lies in the fact that new time-horizon-based benchmarks are continually emerging, and existing benchmarks are being extended to longer tasks. If the underlying statistical model has problems, conclusions drawn from these metrics may need to be reexamined.
From a methodological perspective, this study does not deny the value of the time horizon metric—it offers an interpretable way to express capability, which has unique advantages in the field of AI evaluation. But it reminds researchers and practitioners that any single metric has its scope of applicability and limitations, and particular caution is needed when it comes to extrapolation and cross-range comparisons.
Construct Validity is a core concept in psychometrics and social science methodology, referring to whether a measurement tool truly measures the theoretical construct it claims to measure. For example, if a benchmark intended to measure "AI coding capability" actually reflects more the model's familiarity with specific programming languages rather than general software engineering reasoning ability, then its construct validity is questionable. Assessing construct validity typically requires multiple lines of evidence: convergent validity with other tools known to measure the same construct, discriminant validity with tools measuring different constructs, and whether measurement results can distinguish between groups as theoretically expected. In the field of AI evaluation, construct validity issues are receiving increasing attention because benchmark scores are often directly interpreted as "capability levels," yet the design choices of benchmark tasks, scoring methods, and statistical models can all introduce variance unrelated to the target construct. The recommendation in this paper to interpret time horizon in conjunction with diagnostic charts is precisely aimed at providing researchers with empirical evidence for judging construct validity.
Three Implications for AI Evaluation Practice
First, time horizon reports should be accompanied by diagnostic information. The diagnostic charts provided by the study can help judge the reliability of time horizon estimates on a given dataset, avoiding blind comparisons.
Second, cross-range comparisons require caution. Tasks in different time ranges are not uniformly distributed in terms of AI difficulty, and simple multiplicative comparisons may produce misleading conclusions.
Third, as benchmark tasks extend to longer time spans, the impact of nonlinearity will become more pronounced. Models that perform well on short tasks may not maintain the same capability growth curve on long tasks.
This study has been published on arXiv, and its spline estimation method and diagnostic tools provide a more robust statistical foundation for AI capability evaluation. For researchers who rely on METR time horizon for model comparisons and trend judgments, these findings deserve serious consideration.
One-line Summary
METR time horizon's linear assumption does not hold; AI difficulty is nearly flat in the 2-30 minute range, and cross-range comparisons require caution.
Paragraph Summary
A new study reanalyzed the statistical model behind the METR time horizon metric and found that its core assumption—that AI difficulty has a linear relationship with the logarithm of human completion time—does not hold in actual data. The research team used spline functions and Item Response Theory to recalculate data from 228 tasks and 26 AI models, finding that the fitted curve is nearly flat in the 2-to-30-minute range, meaning that within this range, increases in human time barely change task difficulty for AI. Therefore, a 10x jump from 3 minutes to 30 minutes corresponds to a far smaller increment in AI difficulty than an equivalent jump from 30 minutes to 5 hours. The new estimates perform better under cross-validated scoring rules and provide diagnostic charts to help assess construct validity. The study recommends including diagnostic information when reporting time horizon, exercising particular caution in cross-range comparisons, and notes that as benchmarks extend to longer time spans, the impact of nonlinearity will become more pronounced.
Related articles

Chain of Thought Isn't Just for AI: How Humans Can Use CoT to Improve Thinking Quality
Chain of Thought isn't just a prompt trick for large models. Starting from a Hacker News discussion, this article analyzes why CoT works for human thinking too, breaks down actionable ways to transfer it, and highlights the key differences between human CoT and machine CoT.
Cloudflare Teams Up with OpenAI: Closi…
Cloudflare Teams Up with OpenAI: Closing the Loop from Vulnerability Discovery to Defense with AI
Cloudflare uses OpenAI Daybreak to investigate security vulnerabilities and generate reviewable remediation plans, while developers use Codex to boost coding efficiency and quality.

Orca Multi-Agent Orchestration in Practice: A Guide to Parallel Collaboration with Claude and Codex
Orca is Stable AI's free open-source agent workbench supporting 34 agents like Claude Code and Codex in parallel. Learn its Git worktree isolation, multi-model orchestration, and mobile management.