MID: A New Paired-Free Distribution-Level Evaluation Metric for Medical Image Segmentation

MID introduces a distribution-level segmentation metric that measures whether predictions faithfully reproduce the annotation distribution without per-sample pairing.
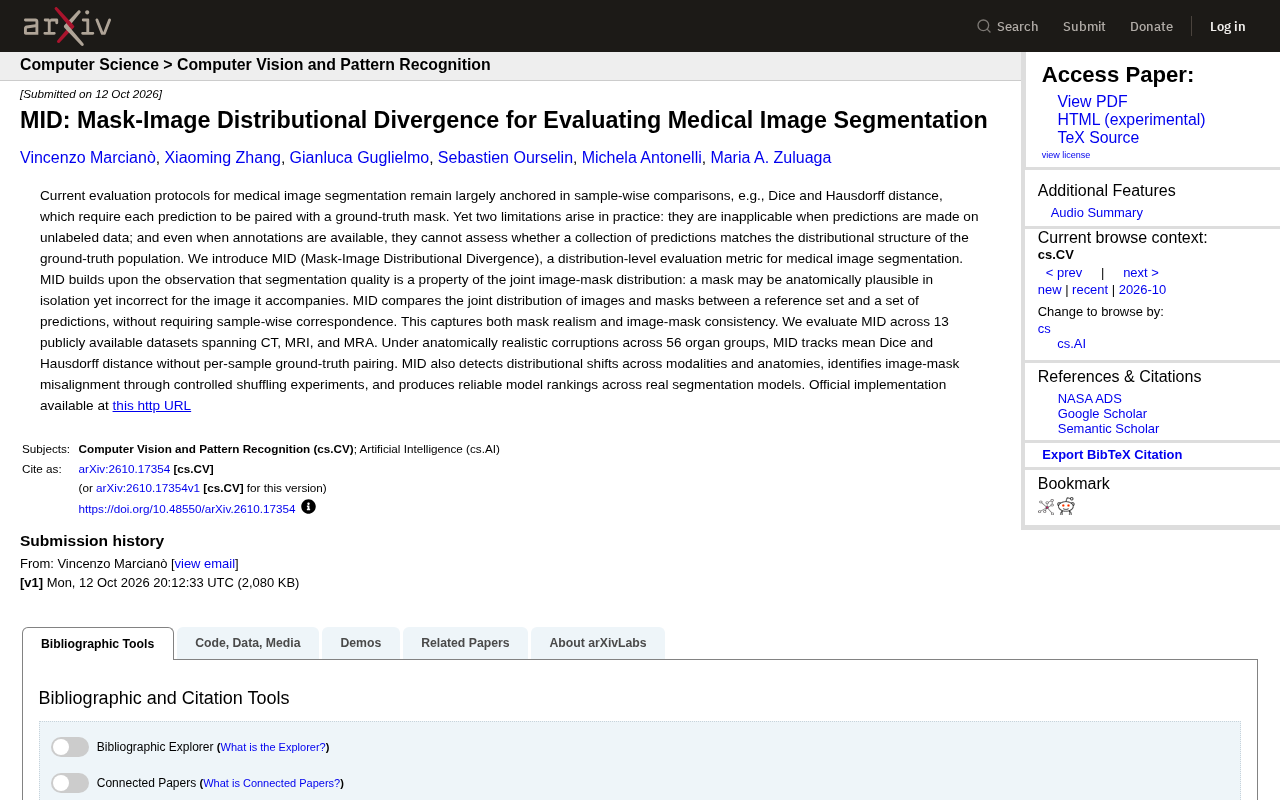
Medical image segmentation evaluation has long relied on per-sample metrics like Dice and Hausdorff, which require each predicted mask to be paired with a ground-truth annotation, fail in unlabeled clinical deployment, and cannot answer whether an entire batch of predictions faithfully reproduces the real annotation structure at the distribution level. Caravel Lab's MID (Mask-Image Distributional Divergence) directly compares two image-mask joint distributions—reference and prediction sets—without sample-level correspondence, capturing both mask realism and image-mask consistency. Validated on 13 public datasets (CT/MRI/MRA) across 56 organ groups, MID can track Dice and Hausdorff trends, detect cross-modal distribution shifts, identify image-mask misalignment, and produce reliable model rankings. The official implementation is open-sourced, offering a new evaluation approach for annotation-scarce medical imaging teams.
When Dice Isn't Enough: The Blind Spot in Medical Image Segmentation Evaluation
Evaluation of medical image segmentation has long relied on per-sample comparison methods such as the Dice coefficient and Hausdorff distance. These require every predicted mask to be paired one-to-one with a human-annotated ground truth. This premise holds in the lab, but frequently falls apart in real-world scenarios.
On one hand, when a model is deployed on unlabeled data (extremely common in clinical settings), per-sample metrics simply fail—without annotations, there is no way to compute Dice. On the other hand, even when annotations are available, per-sample metrics can only tell you "how similar this prediction is to this annotation," but cannot answer a more macro-level question: does this entire batch of predictions faithfully reproduce the structure of the real annotation population at the distribution level?
Researchers from Caravel Lab have proposed MID (Mask-Image Distributional Divergence), a distribution-level evaluation metric for medical image segmentation, aiming to fill this gap. The official implementation is open-sourced at github.com/erc-caravel/pytorch-mid.
Dice Similarity Coefficient measures the degree of overlap between a predicted mask and the ground-truth annotation, ranging from 0 to 1, computed as twice the intersection divided by the sum of total pixels (or voxels) of both. It is sensitive to overlap in large regions but tends to give overly optimistic scores on small targets or boundary regions. Hausdorff distance takes the maximum nearest distance between the set of predicted boundary points and the set of ground-truth boundary points, making it extremely sensitive to worst-case boundary conditions, and it is commonly used to capture shape deviations and outliers. Both are per-sample metrics: a pairing of "this image corresponds to this annotation" must exist before they can be computed. Their shared limitation is that they treat each sample independently, cannot characterize the distributional properties of a prediction set as a whole, and cannot be computed directly on unlabeled data.
Core Insight: Segmentation Quality Is a Property of the Joint Distribution
MID's starting point is a seemingly simple yet often overlooked judgment: segmentation quality is a property of the image-mask joint distribution.
A mask viewed in isolation may be anatomically perfectly reasonable—natural organ shape, smooth boundaries, no obvious artifacts—but if it does not correspond to that image, it is wrong. Traditional per-sample metrics can capture this misalignment when a pairing exists, but their vision is confined to a single sample and cannot measure the distributional gap between "the overall prediction set" and "the real annotation set."
MID's approach is to directly compare two joint distributions: the reference set (real image-mask pairs) and the prediction set (image-predicted mask pairs), without requiring any sample-level correspondence. This enables it to simultaneously capture information in two dimensions—the realism of the mask itself, and the consistency between image and mask. In other words, MID penalizes both "masks that don't look like organs" and "masks that look like organs but are paired with the wrong image."
Joint distribution describes the probability structure of two random variables taking values simultaneously, here referring to the distribution P(X, Y) of "image X" and "mask Y" appearing together as a pair. Per-sample metrics are actually comparing prediction ŷ with y given a pairing (x, y), which is a conditional-level measurement; whereas MID compares the difference between two joint distributions: P_ref(X, Y) of the reference set and P_pred(X, ŷ) of the prediction set. This means MID does not care whether "the i-th prediction corresponds to the i-th annotation"; it only cares whether the overall statistical structure of the two batches of (image, mask) pairs is consistent. It is precisely this shift in perspective that enables MID to simultaneously penalize unrealistic masks (deviation in the marginal distribution of Y) and image-mask mismatches (disruption of the dependency between X and Y).
Systematic Validation on 13 Datasets
The researchers evaluated MID on 13 public datasets, covering three modalities: CT, MRI, and MRA. The validation design centered on several key questions:
Tracking capability. After applying anatomically reasonable corruptions across 56 organ groups, MID was able to track the trends of mean Dice and Hausdorff distance without using per-sample ground-truth pairings. This means MID can serve as a proxy for traditional metrics in unlabeled scenarios.
Distribution shift detection. MID can identify distributional shifts between different modalities and between different anatomical structures, a capability that per-sample metrics struggle to characterize systematically.
Image-mask misalignment identification. Through controlled shuffling experiments (randomly shuffling the pairing of images and masks), MID successfully detected image-mask misalignment. This directly validates its sensitivity to "joint distribution consistency."
Model ranking reliability. On real multiple segmentation models, the model rankings produced by MID are reliable, indicating that it is not only a diagnostic tool but can also be used for model selection.
Distributional shift refers to inconsistency between the distribution of test or deployment data and the training/reference distribution, commonly manifesting in medical imaging as differences in scanner models, imaging protocols, patient populations, or anatomical structures. Per-sample metrics can still be computed when pairings exist, but cannot systematically characterize "how much the overall distribution has shifted." By directly measuring the distance between two joint distributions, MID is naturally sensitive to such shifts—even if the Dice of each individual sample is acceptable, MID will raise a warning as long as the overall distribution of the prediction set deviates from the reference distribution. A shuffling experiment involves randomly re-pairing images with masks to construct a controlled scenario where "the mask itself is realistic but unrelated to the image," used to test whether a metric can identify this breakdown of joint consistency. It is a common technique for validating the sensitivity of distribution-level metrics.
Why This Matters for Medical Image Segmentation
The deployment scenario for medical image segmentation often looks like this: a model is trained on an annotated dataset, then pushed to run on a large volume of unlabeled clinical data. At this point, the team most wants to know—is this batch of predictions reliable overall? Is there systematic drift?
Dice and Hausdorff cannot help in this scenario. MID offers an approach that elevates evaluation from "pairwise comparison" to "distribution comparison": you don't need to know the correct answer for each image; you only need to judge whether the joint distribution of the entire batch of predictions is consistent with the reference distribution. This is especially valuable for the annotation-scarce medical field—annotation costs are high, expert resources are limited, while unlabeled data is readily available.
Another noteworthy angle is MID's handling of the "anatomical plausibility trap." A segmentation model can very well generate masks that look like organs, but are displaced or shape-mismatched on a particular image. Per-sample Dice can catch this error when a pairing exists, but in distribution evaluation, if one only looks at the smoothness or shape statistics of mask boundaries, it is easy to be fooled. MID closes this loophole through joint distribution comparison.
Limitations and Future Directions
The datasets used to validate MID so far are mainly CT, MRI, and MRA; whether it applies to other medical imaging modalities such as ultrasound or pathology slides is not addressed in the paper. Additionally, distribution-level metrics have an implicit dependence on the representativeness and scale of the reference set—if the reference distribution itself is biased, the evaluation conclusions will shift accordingly. These are boundary conditions to be aware of in practical applications.
The open-source implementation is at github.com/erc-caravel/pytorch-mid. For medical imaging AI teams, it is worth trying in the evaluation pipeline.
One-line Summary
MID proposes a distribution-level segmentation evaluation metric that measures whether the overall predictions faithfully reproduce the annotation distribution without per-sample pairing.
Paragraph Summary
Evaluation of medical image segmentation has long relied on per-sample metrics such as Dice and Hausdorff, which require each predicted mask to have a corresponding ground-truth annotation pairing, fail outright in unlabeled clinical deployment scenarios, and cannot answer the macro-level question of whether an entire batch of predictions faithfully reproduces the real annotation structure at the distribution level. MID (Mask-Image Distributional Divergence) proposed by Caravel Lab directly compares two image-mask joint distributions—the reference set and the prediction set—without requiring sample-level correspondence, simultaneously capturing mask realism and image-mask consistency. Researchers validated on 13 public datasets (CT/MRI/MRA) across 56 organ groups that MID can track Dice and Hausdorff trends, detect cross-modal distribution shifts, identify image-mask misalignment, and produce reliable model rankings. The official implementation is open-sourced, offering new evaluation ideas for annotation-scarce medical imaging teams.
Related articles

Felix Rieseberg Personal Homepage
Felix Rieseberg's personal homepage sparks attention on Hacker News. This article covers the Slack engineer's technical background, the rise and fall of nativefier, and the value of a developer homepage as a tech calling card.

@ai-sdk/vue 3.0.306 Patch Release Syncs with [email protected] Update
@ai-sdk/vue 3.0.306 released, synced with [email protected]. A routine patch release for the Vercel AI SDK ecosystem with no public API changes; the Vue adapter layer stays version-aligned with the core package.

Gemini 4 Argon API Launches: The Era of Million-Token Output Begins
Google launches Gemini 4 Argon with sparse MoE architecture, up to 1M output tokens, and a 68.90% Vals Index score, available across API, AI Studio, and the Gemini app.